Just commissioned an Enphase Envoy system and got the integration into HASS working well.
One thing that I can’t get my head around is what consumption is being measured by sensor.envoy_current_power_consumption?
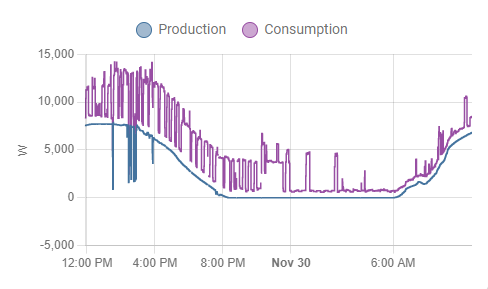
What I’m finding is that the above consumption sensor has an almost linear relationship with solar production, which is unusual. The issue this creates for me is that the export sensor, which I’ve created as per @del13r instructions in the first post is never positive as for some reason my consumption always exceeds production.
I don’t have a lot of data yet but if I look in the Enlighten portal, I already have enough exported energy today to register in the above Home Assistant sensor as a positive value.
Production CT clamp appears fine as it is near 0 when the sun is down.
Consumption CT clamp is definitely not reporting properly.
I’d suggest calling the installer to double check their work and placement of the consumption CT Clamp.
This state for sensor.envoy_SERIALNUMBER_current_power_consumptiom
As an example: From 2am to 7am, the pool pump was on. Then 6am to 7am, my air conditioning comes on.
This house consumption and grid import can be clearly seen on the graph before the panels start producing power from 7am onwards and then I start exporting from 8am onwards.
Thanks for the reply. I’m not sure about the Consumption CT clamp being incorrectly installed… This is what mine looks like so far today - clear sunny day in Melbourne. The issue is that Enlighten clearly reports export to the grid (albeit small) but that is simply not registering in HA.
So the issue could be something in the way HASS is collecting and aggregating the data perhaps from the template sensors? Perhaps something to do with the different sampling frequency between Enlighten and HASS?
I’ve also checked http://envoy.local and the “spot” consumption figure there matches the HASS value 100%. So I’m wondering if the issue is in the above - data sampling/aggregation by HASS?
I disagree.
Your graph is showing import and export at the same time.
It is physically impossible to be both importing and exporting power at the exact same time.
Grid Electricity can only flow 1 way or the other.
import = grid charges you when panels generate less than house consumption
export = grid compensates you when panels generate more than house consumption
Thanks a lot for your help mate. The installers are already onto it. Their project coordinator knew the exact issue I was talking about. Sounds like it happens a fair bit.
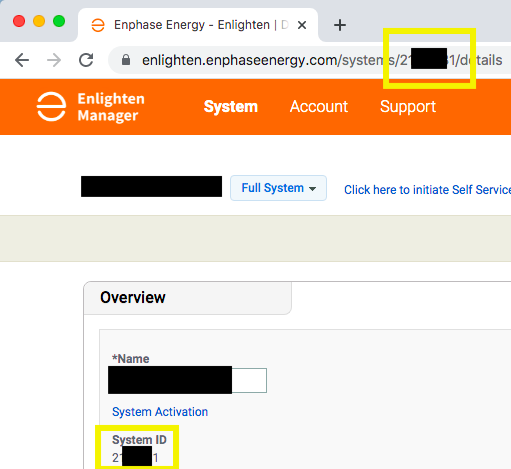
Can someone help me please. I am new in Home assistant and even newer in using API’s. I have HA set up and running on a PI now for a few weeks and realy seems a lot af fun…mostly… a few day’s ago a company set up a battery system with Envoy metered. they could give me 0 technical information about the data readout. after a lot of reading i found the API web of enphase and created a API account , a first application account and this one is green (life) so i think i can use it. Just to start i wanted to use the curl command from a CMD screen to test. Only thing is i just can’t get it running. Every time i got this error {“reason”:“401”,“message”:[“Not authorized to access requested resource”]}* Connection #0 to host api.enphaseenergy.com left intact. iam just not sure where to find all parameters for curl -v “https://api.enphaseenergy.com/api/v2/systems/67/summary?key=1234567890123&user_id=1234567” . is there any location, link, document,website where i can find this information in a simple way .
The other method is direct to the Enphase Envoy at http://envoy.local/production.json which is currently poorly documented and we are waiting for better documentation from Enphase.
Del13r thanks for answering. I am so happy someone answers the question. I already have been reading the page you proposed .I tried that several times the problem is that i still alway’s have the 401 error. i think that i use the ‘wrong’ ENLIGHTEN-USERID’ key . is there a way to find this key so i am absolutely sure that that part is correct. Once more i hope You can find the time to help me start this.
This is why I prefer to poll the Envoy locally and get data that immediately instead of 15 mins late. Plus there should not be any limits on how often you can poll an Envoy locally whereas Cloud API currently has these limits for the free Watt plan.
365 days a year / 12 months a year =
30.4167 days in a month
10,000 hits per month / 30.4167 days in a month =
328.76 hits per day / 24 hours in a day =
13.69 hits per hour
3600 seconds per hour / 13.69 hits per hour allowed =
1 hit every 262.80 seconds / 60 seconds per minute =
1 hit every 4m 23s allowed.
High frequency isnt really needed with Cloud API as the envoy only makes contact and dumps data every 15 mins, so there is really no point checking the cloud that often as you wont see any difference in the results until the next 15 minute dump your envoy makes to the cloud.
You are best off polling the cloud for new info every 15 mins anyway.
Try starting with http://envoy.local/production.json instead if you want just current stats instead of cloud based historical stats and aren’t satisfied with cloud API.
Thanks all for this information. I will start wit that and keep you informed. Just one thing. I was told that the local api I not longer working. Am I wrong there ?