And if using “h1.card-header” - “important” is not required, magic))
How to convert timestamp data into DD/MM/YYYY format:
type: custom:auto-entities
title: date
filter:
  include:
    - domain: device_tracker
      entity_id: '*traccar*'
card:
  type: custom:flex-table-card
  title: date
  columns:
    - name: object
      data: entity_id
      modify: x.split('.')[1].split('_traccar')[0]
    - name: last_updated
      data: last_updated
      modify: |-
        if(x.length == 0)
        {"-"}
        else {
          var date = new Date(x);
          String(date.getDate()).padStart(2,'0')+"/"+
          (String(date.getMonth()+ 1).padStart(2,'0'))+"/"+
          date.getFullYear()+
          " "+
          String(date.getHours()).padStart(2,'0')+":"+
          String(date.getMinutes()).padStart(2,'0')+":"+
          String(date.getSeconds()).padStart(2,'0')
        }
  strict: true
sort:
  method: entity_id
  reverse: false

2 Likes
Hi,
You mentioned in your post that you used JSONata to combine the agile and outgoing rates into one entity? How did you do this? I am keen to standardise the data for both and use to compare etc.
Much appreciated in advance.
I have been teaching myself to use JSONata in Node-RED in preference to using functions and JavaScript code. I pull both the import and export Octopus UK agile tariff prices once per day, and then turn this into a single tariff array which I store in Node-RED context for use as required.
As this thread is about the flex-table-card, I will just post the part of my flow that gets the agile import / export, turns these into one array, and stores it in Node-RED context. This array can be displayed in a flex-table-card as discussed earlier.

The part that you probably want is just the top sequence. Inject trigger to fire once per day, two API calls to Octopus to get the tariffs, change node to move msg.results to msg.payload and set the topic to import/export, a join node that puts both result objects into one object, and a bit of JSONata to get this into one array.
The saved array gets read back from context every 30 minutes to pull the current and next prices, and I also process the array into the best 15 (lowest/highest) import/export periods and combine consecutive groups into longer periods. This gets pushed to HA, where I can display the data.
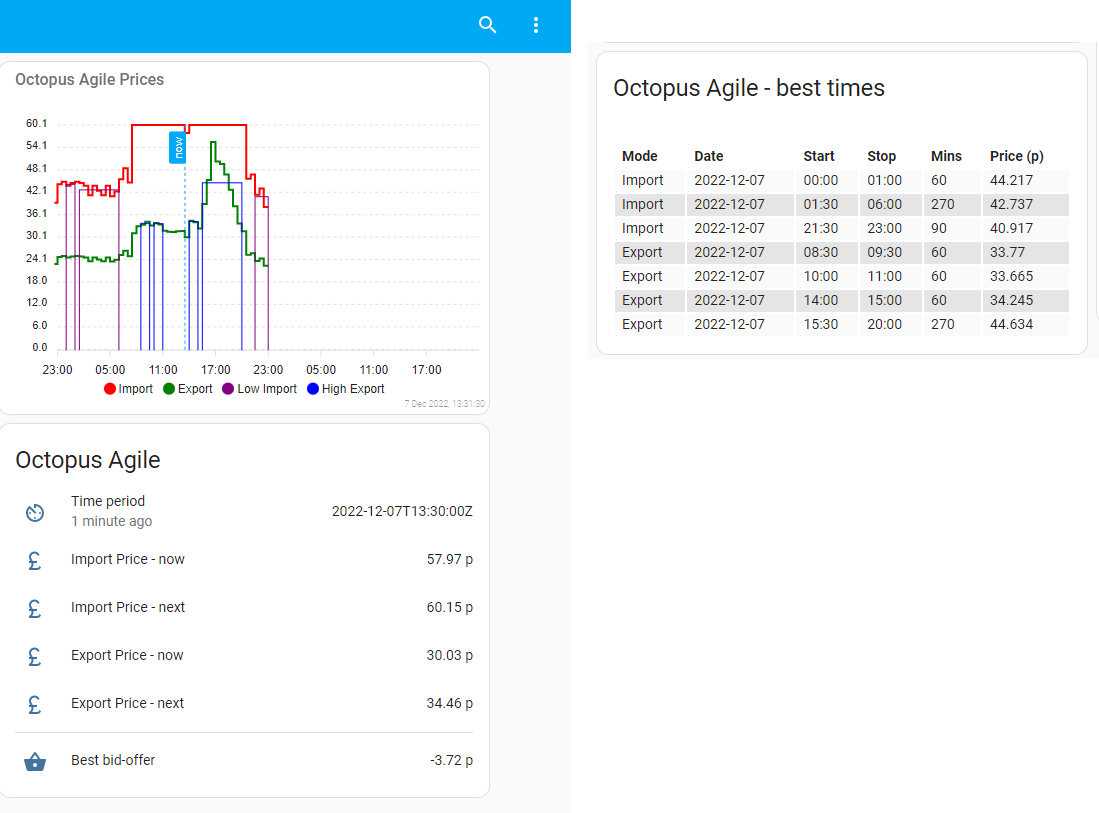
I use the flex-table-card to show tariff prices as well as the best period groups.
Here is the part of the flow that gets both import/export into one array. Note that the API call is set for my region (the South West) and that I am using the most recent agile tariffs that I can find. Octopus are currently not offering agile tariffs, and as I am not using an agile tariff myself I had to hunt around to find the ‘current’ ones. I am pulling 48 hours worth of data (96 half-hour data points) so that my chart always shows at least today up to 23:00, and after 16:00 it will show both today and tomorrow.
[{"id":"db6ebccc4bb88b8d","type":"http request","z":"2dd6b0b4a5f86125","g":"e42010beae8f7fa5","name":"Octopus Export","method":"GET","ret":"obj","paytoqs":"ignore","url":"https://api.octopus.energy/v1/products/AGILE-OUTGOING-19-05-13/electricity-tariffs/E-1R-AGILE-OUTGOING-19-05-13-L/standard-unit-rates/?page_size=96","tls":"","persist":false,"proxy":"","insecureHTTPParser":false,"authType":"","senderr":false,"headers":[],"x":320,"y":1960,"wires":[["65094b21c3938d73"]]},{"id":"63bba87f93e0eaae","type":"http request","z":"2dd6b0b4a5f86125","g":"e42010beae8f7fa5","name":"Octopus Import","method":"GET","ret":"obj","paytoqs":"ignore","url":"https://api.octopus.energy/v1/products/AGILE-22-08-31/electricity-tariffs/E-1R-AGILE-22-08-31-L/standard-unit-rates/?page_size=96","tls":"","persist":false,"proxy":"","insecureHTTPParser":false,"authType":"","senderr":false,"headers":[],"x":320,"y":1920,"wires":[["22fdc0bfd7bdd329"]]},{"id":"65094b21c3938d73","type":"change","z":"2dd6b0b4a5f86125","g":"e42010beae8f7fa5","name":"Results","rules":[{"t":"set","p":"payload","pt":"msg","to":"payload.results","tot":"msg"},{"t":"set","p":"topic","pt":"msg","to":"export","tot":"str"}],"action":"","property":"","from":"","to":"","reg":false,"x":480,"y":1960,"wires":[["3c0e6412766b7286"]]},{"id":"22fdc0bfd7bdd329","type":"change","z":"2dd6b0b4a5f86125","g":"e42010beae8f7fa5","name":"Results","rules":[{"t":"set","p":"payload","pt":"msg","to":"payload.results","tot":"msg"},{"t":"set","p":"topic","pt":"msg","to":"import","tot":"str"}],"action":"","property":"","from":"","to":"","reg":false,"x":480,"y":1920,"wires":[["3c0e6412766b7286"]]},{"id":"3c0e6412766b7286","type":"join","z":"2dd6b0b4a5f86125","g":"e42010beae8f7fa5","name":"Combine","mode":"custom","build":"object","property":"payload","propertyType":"msg","key":"topic","joiner":"\\n","joinerType":"str","accumulate":false,"timeout":"","count":"2","reduceRight":false,"reduceExp":"","reduceInit":"","reduceInitType":"num","reduceFixup":"","x":640,"y":1920,"wires":[["416e22ecfcbf5616"]]},{"id":"0ba1d9b378092267","type":"inject","z":"2dd6b0b4a5f86125","g":"e42010beae8f7fa5","name":"@ 16:05","props":[{"p":"payload"}],"repeat":"","crontab":"05 16 * * *","once":true,"onceDelay":"2","topic":"","payload":"","payloadType":"date","x":140,"y":1920,"wires":[["db6ebccc4bb88b8d","63bba87f93e0eaae"]]},{"id":"416e22ecfcbf5616","type":"change","z":"2dd6b0b4a5f86125","g":"e42010beae8f7fa5","name":"Build & Save Tariff Array","rules":[{"t":"set","p":"payload","pt":"msg","to":"payload.import#$i.{\t \"from\": valid_from,\t \"upto\": valid_to,\t \"date\": $substring(valid_from,0,10),\t \"timefrom\": $substring(valid_from,11,5),\t \"timeupto\": $substring(valid_to,11,5),\t \"import\": value_inc_vat,\t \"export\": %.export[$i].value_inc_vat\t}^(from)","tot":"jsonata"},{"t":"set","p":"OctAgileTariff","pt":"flow","to":"payload","tot":"msg","dc":true}],"action":"","property":"","from":"","to":"","reg":false,"x":830,"y":1920,"wires":[["56dd710454ea2e25"]]}]
I hope this is of some use.
2 Likes
Hi there,
I’m attempting to do the same league table as you. Could you please post your code for this? Thanks!
How to show multiline data:
Two examples below:
- Show any text below a value (could be a static text or a current time, for instance).
- Show 2 (or more) attributes’ values on different strings.
- Same as above + modifying values.
Also, check the last example from Using “div”, “span” & “ha-icon” for a header.

code
type: custom:auto-entities
filter:
  include:
    - entity_id: sun.sun
card:
  type: custom:flex-table-card
  columns:
    - name: ' '
      data: name
    - name: Elevation
      data: elevation
      modify: String(x) + "\nsome_text"
    - name: Elevation
      data: elevation, state
      multi_delimiter: <br>
    - name: Elevation
      data: elevation, state
      modify: >-
        var value1=String(x.split(' ')[0]);
        var value2=String(x.split(' ')[1]);
        value2.toUpperCase() + '\n' + value1*2;
  strict: true
  css:
    tbody tr:nth-child(1) td:nth-child(2)+: 'color: red; white-space: pre;'
    tbody tr:nth-child(1) td:nth-child(4)+: 'color: cyan; white-space: pre;'
1 Like
I’m using the flex-table to show some detailed weather informaton. For the wind bearing I’d like to show a rotated arrow using a ha-icon:

type: custom:flex-table-card
entities:
  include:
    - weather.forecast
columns:
  - name: Wind
    data: forecast
    modify: >-
      '<ha-icon icon="mdi:arrow-up">'
I tried css to rotate the arrow but every line has it’s own wind bearing. So using the css is cumbersome if the forecast has a lot of lines.
I tried:
modify: '''<ha-icon icon="mdi:arrow-up" style="transform:rotate(45deg)">'''
That didn’t work either.
Does anyone have a hint?
1 Like
Check this:
input_number:
  test_angle:
    min: 0
    max: 360
    step: 5
    mode: slider
type: vertical-stack
cards:
  - type: entities
    entities:
      - input_number.test_angle

  - type: custom:flex-table-card
    title: 'icon: rotate'
    entities:
      include:
        - input_number.test_angle
    columns:
      - name: value  ## column 1
        data: state
      - name: icon  ## column 2
        data: state
        modify: '''<ha-icon icon="mdi:arrow-up">'''
      - name: icon colored  ## column 3
        data: state
        modify: '''<ha-icon icon="mdi:arrow-up" style="color: red">'''
      - name: icon rotated (unstable)  ## column 4
        data: state
        modify: '''<ha-icon icon="mdi:arrow-up" >'''
      - name: icon rotated (failed)  ## column 5
        data: state
        modify: '''<ha-icon icon="mdi:arrow-up" >'''
      - name: icon rotated (failed)  ## column 6
        data: state
        modify: '''<ha-icon icon="mdi:arrow-up" style="transform: rotate(45deg)" >'''
      - name: icon rotated (steps)  ## column 7
        data: state
        modify: |-
          var ICON = 'mdi:arrow-up';
          if (parseFloat(x) >= 315)
            ICON = 'mdi:arrow-top-left';
          else if (parseFloat(x) >= 270)
            ICON = 'mdi:arrow-left';
          else if (parseFloat(x) >= 225)
            ICON = 'mdi:arrow-bottom-left';
          else if (parseFloat(x) >= 180)
            ICON = 'mdi:arrow-down';
          else if (parseFloat(x) >= 135)
            ICON = 'mdi:arrow-bottom-right';
          else if (parseFloat(x) >= 90)
            ICON = 'mdi:arrow-right';
          else if (parseFloat(x) >= 45)
            ICON = 'mdi:arrow-top-right';
          '<ha-icon icon="' + ICON + '">'
    css:
      tbody tr:nth-child(1) td:nth-child(5) ha-icon+: 'color: cyan; transform: rotate(45deg)'
    card_mod:
      style:
        tbody tr:nth-child(1) td:nth-child(4) ha-icon $: |
          ha-svg-icon {
            {% set ANGLE = states('input_number.test_angle')|int %}
            transform: rotate({{ANGLE}}deg) !important;
          }

Column 4 - unstable:
Styling is done by card-mod. Refresh a page - see that the icon is rotated - but soon it will be restored to a previous state.
Column 5 - failed:
Styling is done by a native “css” option; color “cyan” is applied, rotation is not applied - probably because it should be applied to an element inside shadowRoot (“ha-svg-icon”).
Column 6 - failed:
Styling is done inside “modify” option, rotation is not applied - probably because it should be applied to an element inside shadowRoot (“ha-svg-icon”).
Column 7 - OK:
Different icons are used inside “modify”.
2 Likes
Thanks Ildar voor trying the different solutions.
1 Like
IMHO for wind direction the last variant could be rather sufficient.
1 Like
Displaying pictures:
Original idea of @alexandrechoske was described here, all credits to him!
type: custom:auto-entities
filter:
  include:
    - domain: person
card:
  type: custom:flex-table-card
  title: image
  columns:
    - name: object
      data: name
    - name: image
      data: entity_picture
      modify: '''<img src="'' + x + ''"style="width: 100%">'''
    - name: image
      data: entity_picture
  strict: true
sort:
  method: entity_id
  reverse: false

2 Likes
Is it possible to use a template in the title like?:
title: {{ states('sensor.my_sensor') }}
Templates are not supported for the “title” option. But you may use a Markdown card with “flex-table-card” in a vertical stack (plus additional styling with card-mod).
Alternatively, you may add ANY text for the “title” element by using card-mod.
Go to card-mod thread - 1st post - link at the bottom - “using after and before pseudocclasses”
Thanks Ildar, I managed to get it working with adding the text to the title element via card-mod.
You mean to “after” pseudoclass?
Yes, I do.
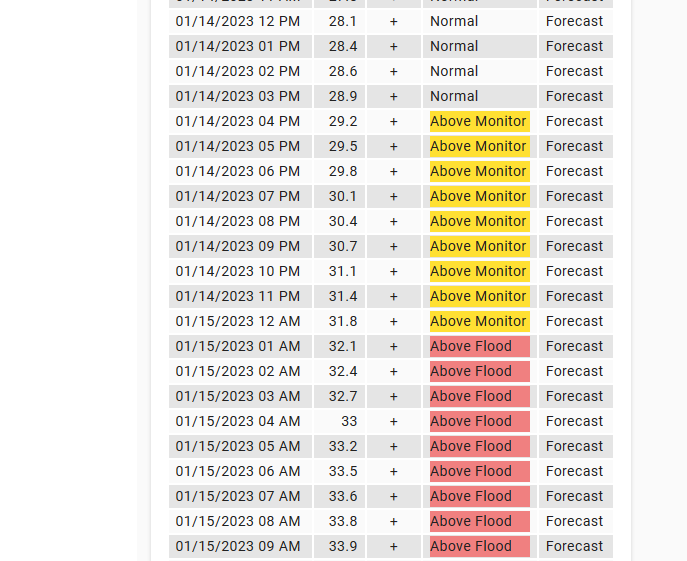
One feature I would love to see supported as I do not know how (without writing custom javascript) one could do it today. Maybe it could be done with modify, but I am not sure. I have a sensor that contains the flood level of (really any) NOAA tracked river. It parses the data from CSV into this sensor. See Create graph/automation based on river level - #8 by kbrown01 for more information.
What I want to achieve is to colorize row(s) based on some content. That said, I would think some generic solution that allowed for row color or cell color based on content would be ideal. If you see this real data:

The yellow area is “Above Monitor”, the red area “Above Flood”. I would welcome any solution that would allow me to colorize the rows (or even the cells but that is not ideal). Right now I have this.
type: custom:flex-table-card
title: Russian River Level
entities:
  include: sensor.russian_river_flood_data
columns:
  - name: Date/Time
    data: flooddata
    modify: x.valid
  - name: Level
    data: flooddata
    modify: x.level
    align: right
  - name: Trend
    data: flooddata
    modify: x.trend
    align: center
  - name: Status
    data: flooddata
    modify: x.status
  - name: Mode
    data: flooddata
    modify: x.mode
I was thinking of some YAML that would allow a person to specify that the column should also have the data in a @data-vaue attribute and that could be used with CSS to color specific cells. Perhaps it could be done with modify though.
To answer my own question (well at least half of it), I can do cells like this:
type: custom:flex-table-card
title: Russian River Level
entities:
  include: sensor.russian_river_flood_data
columns:
  - name: Date/Time
    data: flooddata
    modify: x.valid
  - name: Level
    data: flooddata
    modify: x.level
    align: right
  - name: Trend
    data: flooddata
    modify: x.trend
    align: center
  - name: Status
    data: flooddata
    modify: |-
      switch(x.status){
        case 'Above Monitor':
          '<div style="background-color: #FFE033;">' + x.status + '</div>';
          break;
        case 'Above Flood':
          '<div style="background-color: #F08080;">' + x.status + '</div>';
          break;
        default:
          x.status;
        }
  - name: Mode
    data: flooddata
    modify: x.mode
And to re-answer my question with enhancements:
type: custom:flex-table-card
entities:
include: sensor.russian_river_flood_info
columns:
- name: Date/Time
data: flooddata
modify: x.valid
- name: Level
data: flooddata
modify: |-
switch(x.status){
case 'Above Monitor':
'<div style="background-color: #e67300;">' + parseFloat(x.level).toFixed(1) + ' ft</div>';
break;
case 'Above Flood':
'<div style="background-color: #cc0000;">' + parseFloat(x.level).toFixed(1) + ' ft</div>';
break;
default:
parseFloat(x.level).toFixed(1) + ' ft';
}
align: center
- name: Trend
data: flooddata
modify: |-
switch(x.trend){
case '+':
'<ha-icon icon="mdi:arrow-up" style="color: #e67300;">';
break;
case '-':
'<ha-icon icon="mdi:arrow-down" style="color: #3399ff;">';
break;
default:
'<ha-icon icon="mdi:arrow-all">';
}
align: center

Now, move onto a better solution than scrolling the whole table which is terrible. The scrolling posted above in the author’s samples will not suffice. A table should scroll the body and not the whole table. Should be able to do that in pure CSS
2 Likes
I’m also using the modify to deal with colors per cell, but in my case the color to be used is part of the data:

type: custom:flex-table-card
title: Västtrafik - Svingeln
strict: true
max_rows: 20
sort_by:
- Departure+
entities:
include: sensor.vasttrafik_departure_table
columns:
- name: Sort column
data: Departure
align: center
hidden: true
modify: >-
Math.round((Date.parse((x.rtDate ? x.rtDate : x.Date) + " " + (x.rtTime ?
x.rtTime : x.Time)) - Date.now())/60000)
- name: Line
data: Departure
modify: x.sname
align: center
hidden: true
style: '''background-color: '' + x.bgColor + '';'' + ''color: '' + x.fgColor + '';'''
- name: Line
data: Departure
modify: >-
'<div style="padding: 1px 1px 4px 1px; height: 16px; color: ' + x.fgColor
+ '; background-color: ' + x.bgColor + '"> ' + x.sname +
' </div>'
align: center
- name: Direction
data: Departure
modify: x.direction
- name: Departure
data: Departure
align: center
modify: |-
if (typeof(x.rtTime) == "string" & typeof(x.rtDate) == "string")
{
var minutes = Math.round(Math.max(0,(Date.parse(x.rtDate + " " + x.rtTime) - Date.now())/60000));
if (minutes>=60 || isNaN(minutes))
{{ x.rtTime }}
else if (minutes == 0)
"Now"
else
{{ minutes }}
}
else
{
var minutes = Math.round(Math.max(0,(Date.parse(x.date + " " + x.time) - Date.now())/60000));
if (minutes>=60 || isNaN(minutes))
{{ x.time }}
else if (minutes == 0)
"Now"
else
{{ minutes }}
}
- name: Platform
data: Departure
align: center
modify: >-
x.track + ' <ha-icon icon="mdi:' +
x.type.toLowerCase().replace("tram", "tram-side") + '"></ha-icon>'
css:
tbody tr:nth-child(odd): 'background-color: #535B64;'
tbody tr:nth-child(even): 'background-color: #3C4650;'
style: |
ha-card {
--mdc-icon-size: 16px;
background-color: #3C4650;
}
3 Likes