Flex-table-card

Templates are not supported for the “title” option. But you may use a Markdown card with “flex-table-card” in a vertical stack (plus additional styling with card-mod).

Alternatively, you may add ANY text for the “title” element by using card-mod.
Go to card-mod thread - 1st post - link at the bottom - “using after and before pseudocclasses”

Thanks Ildar, I managed to get it working with adding the text to the title element via card-mod.

You mean to “after” pseudoclass?

Yes, I do.

One feature I would love to see supported as I do not know how (without writing custom javascript) one could do it today. Maybe it could be done with modify, but I am not sure. I have a sensor that contains the flood level of (really any) NOAA tracked river. It parses the data from CSV into this sensor. See Create graph/automation based on river level - #8 by kbrown01 for more information.

What I want to achieve is to colorize row(s) based on some content. That said, I would think some generic solution that allowed for row color or cell color based on content would be ideal. If you see this real data:

The yellow area is “Above Monitor”, the red area “Above Flood”. I would welcome any solution that would allow me to colorize the rows (or even the cells but that is not ideal). Right now I have this.

type: custom:flex-table-card
title: Russian River Level
entities:
  include: sensor.russian_river_flood_data
columns:
  - name: Date/Time
    data: flooddata
    modify: x.valid
  - name: Level
    data: flooddata
    modify: x.level
    align: right
  - name: Trend
    data: flooddata
    modify: x.trend
    align: center
  - name: Status
    data: flooddata
    modify: x.status
  - name: Mode
    data: flooddata
    modify: x.mode

I was thinking of some YAML that would allow a person to specify that the column should also have the data in a @data-vaue attribute and that could be used with CSS to color specific cells. Perhaps it could be done with modify though.

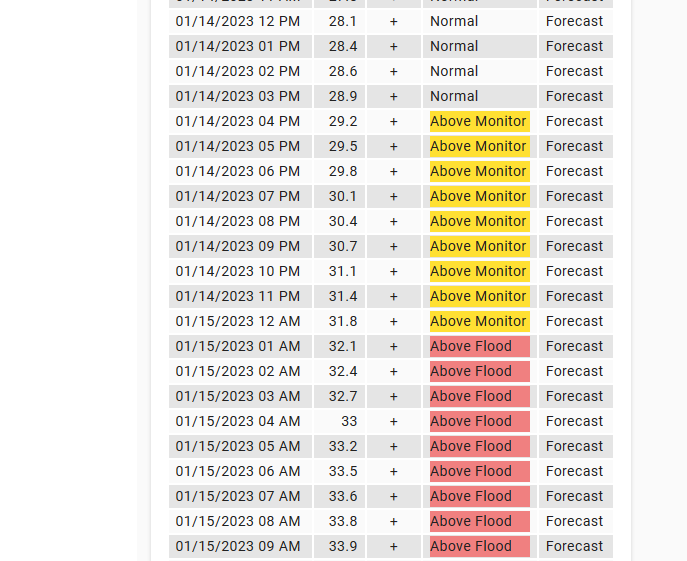
To answer my own question (well at least half of it), I can do cells like this:

type: custom:flex-table-card
title: Russian River Level
entities:
  include: sensor.russian_river_flood_data
columns:
  - name: Date/Time
    data: flooddata
    modify: x.valid
  - name: Level
    data: flooddata
    modify: x.level
    align: right
  - name: Trend
    data: flooddata
    modify: x.trend
    align: center
  - name: Status
    data: flooddata
    modify: |-
      switch(x.status){
        case 'Above Monitor':
          '<div style="background-color: #FFE033;">' + x.status + '</div>';
          break;
        case 'Above Flood':
          '<div style="background-color: #F08080;">' + x.status + '</div>';
          break;
        default:
          x.status;
        }
  - name: Mode
    data: flooddata
    modify: x.mode

And to re-answer my question with enhancements:

type: custom:flex-table-card
entities:
  include: sensor.russian_river_flood_info
columns:
  - name: Date/Time
    data: flooddata
    modify: x.valid
  - name: Level
    data: flooddata
    modify: |-
      switch(x.status){
        case 'Above Monitor':
          '<div style="background-color:  #e67300;">' + parseFloat(x.level).toFixed(1) + '&nbsp;ft</div>';
          break;
        case 'Above Flood':
          '<div style="background-color: #cc0000;">' + parseFloat(x.level).toFixed(1) + '&nbsp;ft</div>';
          break;
        default:
          parseFloat(x.level).toFixed(1) + '&nbsp;ft';
        }
    align: center
  - name: Trend
    data: flooddata
    modify: |-
      switch(x.trend){
        case '+':
          '<ha-icon icon="mdi:arrow-up" style="color:  #e67300;">';
          break;
        case '-':
          '<ha-icon icon="mdi:arrow-down" style="color:  #3399ff;">';
          break;
        default:
          '<ha-icon icon="mdi:arrow-all">';
        }
    align: center

Now, move onto a better solution than scrolling the whole table which is terrible. The scrolling posted above in the author’s samples will not suffice. A table should scroll the body and not the whole table. Should be able to do that in pure CSS

2 Likes

I’m also using the modify to deal with colors per cell, but in my case the color to be used is part of the data:

type: custom:flex-table-card
title: Västtrafik - Svingeln
strict: true
max_rows: 20
sort_by:
  - Departure+
entities:
  include: sensor.vasttrafik_departure_table
columns:
  - name: Sort column
    data: Departure
    align: center
    hidden: true
    modify: >-
      Math.round((Date.parse((x.rtDate ? x.rtDate : x.Date) + " " + (x.rtTime ?
      x.rtTime : x.Time)) - Date.now())/60000)
  - name: Line
    data: Departure
    modify: x.sname
    align: center
    hidden: true
    style: '''background-color: '' + x.bgColor + '';'' + ''color: '' + x.fgColor + '';'''
  - name: Line
    data: Departure
    modify: >-
      '<div style="padding: 1px 1px 4px 1px; height: 16px; color: ' + x.fgColor
      + '; background-color: ' + x.bgColor + '">&nbsp;' + x.sname +
      '&nbsp;</div>'
    align: center
  - name: Direction
    data: Departure
    modify: x.direction
  - name: Departure
    data: Departure
    align: center
    modify: |-
      if (typeof(x.rtTime) == "string" & typeof(x.rtDate) == "string") 
        { 
          var minutes = Math.round(Math.max(0,(Date.parse(x.rtDate + " " + x.rtTime) - Date.now())/60000));
          if (minutes>=60 || isNaN(minutes))
            {{ x.rtTime }}
          else if (minutes == 0)
            "Now"
          else
            {{ minutes }}
        }
      else
        { 
          var minutes = Math.round(Math.max(0,(Date.parse(x.date + " " + x.time) - Date.now())/60000));
          if (minutes>=60 || isNaN(minutes))
            {{ x.time }}
          else if (minutes == 0)
            "Now"
          else
            {{ minutes }}
        }
  - name: Platform
    data: Departure
    align: center
    modify: >-
      x.track + '&nbsp;<ha-icon icon="mdi:' +
      x.type.toLowerCase().replace("tram", "tram-side") +  '"></ha-icon>'
css:
  tbody tr:nth-child(odd): 'background-color: #535B64;'
  tbody tr:nth-child(even): 'background-color: #3C4650;'
style: |
  ha-card {
    --mdc-icon-size: 16px;
    background-color: #3C4650;
  }
3 Likes

@Ildar_Gabdullin … please take a look here and tell me where I am wrong.

I am trying to use flex-table to grab stats that are multiple layers deep. I do not see how this is possible as to me, nothing beyond data: myarray works. data: myarray.myarray does not nor anything I have tried to iterate over things.

Split data into 2 sensors (western & eastern conferences):

template:
  - sensor:
      - name: test_sport_eastern_conf
        state: true  ###could be anything
        attributes:
          standings: >-
            {{ state_attr('sensor.mls_standings_test','children')[0].standings.entries }}

      - name: test_sport_western_conf
        state: true
        attributes:
          standings: >-
            {{ state_attr('sensor.mls_standings_test','children')[1].standings.entries }}

Then create smth like this for each conference:

type: custom:flex-table-card
title: Standings
entities:
  include: sensor.test_sport_western_conf
columns:
  - name: team
    data: standings
    modify: x.team.name
  - name: Games Played
    data: standings
    modify: |
      x.stats[0].displayValue
  - name: Losses
    data: standings
    modify: |
      x.stats[1].displayValue
  - name: Points
    data: standings
    modify: |
      x.stats[2].displayValue
  - name: Goals Against
    data: standings
    modify: |
      x.stats[3].displayValue
  - name: Goals For
    data: standings
    modify: |
      x.stats[4].displayValue
  - name: Draws
    data: standings
    modify: |
      x.stats[5].displayValue
  - name: Wins
    data: standings
    modify: |
      x.stats[6].displayValue
  - name: Point Deductions
    data: standings
    modify: |
      x.stats[7].value
  - name: Goal Difference
    data: standings
    modify: |
      x.stats[8].displayValue
  - name: Points Per Game
    data: standings
    modify: |
      x.stats[9].displayValue
  - name: Rank
    data: standings
    modify: |
      x.stats[10].displayValue
  - name: Rank Change
    data: standings
    modify: |
      x.stats[11].displayValue
  - name: Overall
    data: standings
    modify: |
      x.stats[12].displayValue

This is just an example.
Hope this will help you.

I guess I will live with the four sensor, four card approach …

Results:

Is is possible to use a column in which the data uses a “modify” as a “sort_by”? I have tried but it appears it is not possible. I was trying to extend the four sensors into a different view that combines them back into one card with all teams. I get the data, but I cannot sort this:

entities:
  include:
    - sensor.nhl_east_atlantic
    - sensor.nhl_east_metropolitan
    - sensor.nhl_west_central
    - sensor.nhl_west_pacific
sort_by: x.stats[6].displayValue+
columns:
  - name: Team
    data: entries
    modify: x.team.displayName
  - name: GP
    data: entries
    modify: x.stats[3].displayValue
  - name: W
    data: entries
    modify: x.stats[10].displayValue
  - name: L
    data: entries
    modify: x.stats[4].displayValue
  - name: OTL
    data: entries
    modify: x.stats[11].displayValue
  - name: PTS
    data: entries
    modify: x.stats[6].displayValue

The sort appears as if it can only take the data field and that is generic in this case because it uses modify to grab the exact data needed,

When more than 1 column have the same source, it will sort by the first one, so in order to get to what you want, copy that column to the first column and then add hidden: true, so the column will be there, will be used for sorting, but won’t be visible.

Something like this:

entities:
  include:
    - sensor.nhl_east_atlantic
    - sensor.nhl_east_metropolitan
    - sensor.nhl_west_central
    - sensor.nhl_west_pacific
sort_by:
  - entries
columns:
  - hidden: true
    data: entries
    modify: x.stats[6].displayValue
  - name: Team
    data: entries
    modify: x.team.displayName
  - name: GP
    data: entries
    modify: x.stats[3].displayValue
  - name: W
    data: entries
    modify: x.stats[10].displayValue
  - name: L
    data: entries
    modify: x.stats[4].displayValue
  - name: OTL
    data: entries
    modify: x.stats[11].displayValue
  - name: PTS
    data: entries
    modify: x.stats[6].displayValue
1 Like

Tried that, no bueno:

Even with the column not hidden it doesn;t work I can tell that even in the original because it would assume that the sort would be team name. Tried you sample too with no name, none of those work. Nothing sorts as far as I can see unless it is sorted by a direct attribute without “modify”

  - hidden: true
    data: entries
    modify: x.stats[6].displayValue

Now of course I could create a new sensor but no. It already is bad enough that NHL needs 5 sensors (and NFL 7, and MLB 7) just to have conference and division breakdowns.

EDIT: I did not put sort_by: entries!!!

That works!

That is huge. So now for my major sports card, I can have Divisional, Conference and Overall stats. Then onto what logic to apply for possibly implementing Wild Card

1 Like

entries is a list, each element is a dictionary, isn’t it?
Then how this “sort_by” is supposed to work?
What you should have done and you did not - specifying an ID for a particular column and selecting this ID for sorting.

Exacty. Understood. At first I had tried with the wrong “sort_by” and thught it over. The missing link is from @EdwardTFN. I would not have “guessed” that given a frankly not-sortable entry yet “sort_by” is provided , it sorts by the first column

Right now working perfectly for Divisional, Conference and Overall. Just need to think through the logic of wildcard.

Division:

Conference:

Overall:

Nice)
Hope your home has become much smarter with this sport info)))
Seriously, so far I have found only one application in my HA for this card - some tech info about network switches, that is all…

LOL!

I have a simplistic view. I hate going to other Apps/Websites. I like in all in one thing. Especially one that does not track everything I do.

Flex table has help me with River Flood status and now Sports scores and standings.
All lights, music, tv remotes, internet status, cell phones, calendars … and yes even Pokemon for the kids.

I post most all the results and YAML and such on GIT for others.

Probably the main reason of not using table in my setup is that for almost each sensor I have Entities card + graphs + buttons…
It will be great if you share some ideas of using this card.

For me - even only screenshots with description will be fine, w/o code.

How to reduce decimal accuracy as stated in other cards and the new HA version 2023.3.0?