Flex-table-card

The icon is one of the sensor attributes. Want this to be clickable to a chart.

type: custom:flex-table-card
entities:
  include: sensor.yahoofinance*
columns:
  - name: Trend
    data: icon
  - name: Stock
    data: friendly_name
  - name: Pris $US
    data: state
  - name: ∆%
    data: regularMarketChangePercent
  - name: Link
    data: symbol
    modify: '''<a href=https://finance.yahoo.com/quote/'' + x + '' target="_blank">Link</a>'''

Hi All,

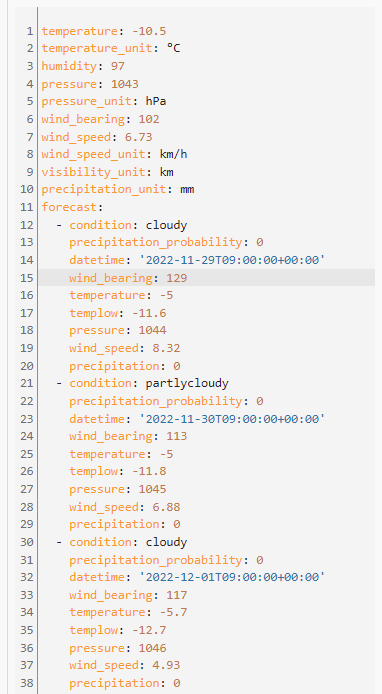
I have a sensor with JSON attributes:

and want to export part into a table just showing the “valid_from” time and “value_inc_vat”. I have tried the following with no entries in the table:

type: custom:flex-table-card
title: Outgoing Rates
entities:
  include: sensor.octopus_outgoing.results
columns:
  - name: Start
    data: valid_from
  - name: Rate
    data: value_inc_vat

and then this:

type: custom:flex-table-card
title: Outgoing Rates
entities:
  include: sensor.octopus_outgoing
columns:
  - name: Start
    data: results.valid_from
  - name: Rate
    data: results.value_inc_vat

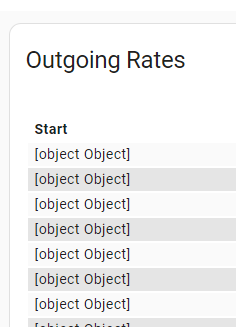
I get this:
image
When I do this:

type: custom:flex-table-card
title: Outgoing Rates
entities:
  include: sensor.octopus_outgoing.results
columns:
  - name: Start
    data: results

I get:
image

Any pointers gratefully received!

Cannot reproduce your case, try this:

  - name: xxx
    data: results
    modify: x[0].value_exc_vat

Thanks for the pointer, although that still doesn’t seem to work:
image

Well, cannot help then, have no similar sensors.

I spot an array of Octopus Agile Export!

Yup, the flex-table-card is a bit tricky to set up, particularly with sensor attributes. I have several tables and am finally getting the hang of this (rather nice) card. If anything is wrong, then all you get is a pink square with an error message…

I have manipulated my data into different sensor arrays, so my names will not match yours, however, the following works for me:
Sensor - octopus_agile_prices (which has an attribute)
Attribute - array (which is an array of objects)
Start time - from (which is the Octopus valid_from)
Export value - export (which is the Octopus export price - I have combined both import and export into one array using JSONata, but that is another story…)

The entities: include should be the sensor (at the top level only).
This makes the card look at the sensor. Then for each column we want, we set the data as the attribute name, which makes the column look at the attribute.
Then for the value, we need the ‘modify’ operator to pull out the field from the attribute, hence ‘x.field_name’ where x represents the entity attribute, and the field name is the bit we want.

The fact that the (final) data is an array causes the card to display rows based on each value in the array.

You probably need something like

entities:
  include: sensor.octopus_outgoing
columns:
  - name: Start
    data: results
    modify: x.valid_from
  - name: Rate
    data: results
    modify: x.value_inc_vat

(errors and omission excepted)
EDITED extra ‘columns’ was an error!

WARNING - the ‘modify’ function calls JavaScript eval() as part of what it does, and this can be a security issue, hence the use of this feature is avoided by many.

1 Like

Now I am curious…
Since you specified only one “sensor.octopus_outgoing” sensor, then only one row is expected to present in the table - how do you get many rows?
Also, a person above provided a screenshot from “Dev tools → state” where there is one “results” attribute which is an array. And in your example you specified an “array” attribute. - I see that you edited the code, it differs from a screenshot.
Since your code is a GUESS not a really working code - I also doubt that it will work.

Can anyone propose me a sensor with a similar structure?
I need it for testing…

OMG, you are right - the code works.
I used an OpenWeatherMap sensor:

type: custom:flex-table-card
entities:
  include:
    - weather.home_openweathermap
columns:
  - name: date
    data: forecast
    modify: x.datetime
  - name: condition
    data: forecast
    modify: x.condition
  - name: temperature
    data: forecast
    modify: x.temperature
  - name: templow
    data: forecast
    modify: x.templow
  - name: pressure
    data: forecast
    modify: x.pressure
  - name: wind_bearing
    data: forecast
    modify: x.wind_bearing
  - name: wind_speed
    data: forecast
    modify: x.wind_speed
  - name: precipitation
    data: forecast
    modify: x.precipitation
  - name: precipitation_probability
    data: forecast
    modify: x.precipitation_probability

The strangest thing for me is that:
– there is only ONE sensor is specified - so only ONE row is expected;
– the attribute “forecast” is an array - so a “forecast[2].condition” syntax is supposed to be used:

Probably the author is expanding one “array attribute” to several rows - as it mentioned in the docs:


Then I do admire this card even much more!


More explanations are here.

1 Like

My code certainly works for me, and yes I have spent a lot of time experimenting with this card to try and figure out how it all works.
My sensor attribute is an array, and rather obviously I called it ‘array’ because it is…

The tricky part about this card is the way it works out the 1 entity = 1 row OR multiple values = multiple rows (same entity - one value per row).

If you have a sensor with one value, then that ends up in 1 row. The columns then become holders for different sensor values.
If you have a sensor.attribute with one value, then that ends up in 1 row. The columns are again for different sensor or sensor.attribute values.
If you have a sensor.attribute that is an array, then that ends up with each row=1 item from the array, but the card cannot get at the data directly, hence the use of the modify function.

The code behind the card seems to cast the card into one-row / multiple-rows per entity based on the first item it sees, and then you have to work with the card based on that. Takes a little bit of thought and a lot of experimentation to get the best from this.

Hoorah! Yes that works! Although I had to remove the second columns: in your suggested code. And your explanation is really helpful in aiding my understanding, thank you.

And yes, it’s Octopus Agile Export :slight_smile:

Thank you so much!

Ah yes, my error indeed. I usually like to fully test any ‘code’ I propose but I winged that one in a rush. For posterity I have edited my earlier post to (now hopefully) correct it!

1 Like

I was wondering how to change the custom:flex-table-card's title. Sounds easy, right? Well…

I use this (removed unnecessary parts) and card-mod is not applied at all:

type: conditional
conditions:
  - entity: sensor.updater_any
    state: 'True'
card:
  type: custom:collapsable-cards
  title: 🆕 Updates
  defaultOpen: desktop-only
  buttonStyle: 'font-size: x-large;'
  cards:
    - type: custom:vertical-stack-in-card
      title: ''
      state_color: true
      show_header_toggle: false
      cards:
        - type: custom:auto-entities
          filter:
            include:
              - entity_id: update.*
                state: 'on'
          card:
            type: custom:flex-table-card
            title: 'Übersicht verfügbarer Updates:'
            clickable: true
            columns:
              - name: ' Name'
                data: friendly_name
                modify: x.split(":")[0];
                prefix: ''
                suffix: ''
                align: left
                icon: null
              - name: ' Update(s)'
                data: state
                modify: x.replace("on", "Ja"),x.replace("true", "on")
                prefix: ''
                suffix: ''
                align: left
                icon: null
            sort_by:
              - friendly_name+
              - state+
            card_mod:
              style:
                .: |
                  .card-header {
                    font-size: 16px;
                    font-weight: bold;
                    padding: 5px;
                    padding-top: 0px;
                    margin-left: 20px;
                    margin-bottom: -30px;
                  }

I used site inspector and card-header is the right thing. Probably it’s because of the various cards around custom:flex-table-card? I bet on “navigation error”… what do you think @Ildar_Gabdullin (please don’t laugh at me :smiley: )?

Surely I will - since your code with “removed unnecessary parts” still has a lot of staff not related to the flex-table-card.
First - check again only a part starting from this:

        - type: custom:auto-entities
          filter:

to isolate a table card from other cards (auto-entities needed to fill rows).

1 Like

Anyway,

  1. Please always post a Minimal working example to demonstrate a problem.
  2. The card-mod style in your post is wrong - the ".card-header" element is located inside a shadowRoot of "ha-card" (there is a probability that this changed in the latest card-mod).

So, the style should be like this:

    card_mod:
      style:
        $: |
          .card-header {
            color: red !important;
            padding-top: 0px !important;
            padding-bottom: 0px !important;
            font-size: 40px !important;
            background-color: yellow;
          }

It works fine either the "flex-table-card" is placed into "auto-entities" or filtering is done by the "flex-table-card" itself:

type: vertical-stack
cards:
  - type: custom:flex-table-card
    title: attrs
    entities:
      include: light.*
    columns: &ref_columns
      - name: brightness
        data: brightness
      - name: color_mode
        data: color_mode
    strict: true
    card_mod: &ref_card_mod
      style:
        $: |
          .card-header {
            color: red !important;
            padding-top: 0px !important;
            padding-bottom: 0px !important;
            font-size: 40px !important;
            background-color: yellow;
          }
  - type: custom:auto-entities
    filter:
      include:
        - entity_id: light.*
    card:
      type: custom:flex-table-card
      title: attrs
      entities:
        include: light.*
      columns: *ref_columns
      strict: true
      card_mod: *ref_card_mod

Do not bother about this glitch in the top corners:
изображение
it happens due to a brand new border style (pure Material 3).

2 Likes

Thank you so much! Indeed that latest 3.2.0 release containing this “fix” must have broken this. I’m on HA Core 2022.9, hopefully I won’t make changes again once updated to HA Core 2022.11…

So yes, I had a “navigation error” (used .: | instead of $: |).

Interestingly, only the margin-left: 20px; is applied without adding !important, all other styles explicitly need !important.

Will now check all my remaining views and dashboards, hopefully only .card-header sections are affected.

Thanks a lot again Ildar! :heart:

1 Like

And if using “h1.card-header” - “important” is not required, magic))

How to convert timestamp data into DD/MM/YYYY format:

type: custom:auto-entities
title: date
filter:
  include:
    - domain: device_tracker
      entity_id: '*traccar*'
card:
  type: custom:flex-table-card
  title: date
  columns:
    - name: object
      data: entity_id
      modify: x.split('.')[1].split('_traccar')[0]
    - name: last_updated
      data: last_updated
      modify: |-
        if(x.length == 0)
        {"-"}
        else {
          var date = new Date(x);
          String(date.getDate()).padStart(2,'0')+"/"+
          (String(date.getMonth()+ 1).padStart(2,'0'))+"/"+
          date.getFullYear()+
          " "+
          String(date.getHours()).padStart(2,'0')+":"+
          String(date.getMinutes()).padStart(2,'0')+":"+
          String(date.getSeconds()).padStart(2,'0')
        }
  strict: true
sort:
  method: entity_id
  reverse: false

изображение

1 Like

Hi,
You mentioned in your post that you used JSONata to combine the agile and outgoing rates into one entity? How did you do this? I am keen to standardise the data for both and use to compare etc.
Much appreciated in advance.

I have been teaching myself to use JSONata in Node-RED in preference to using functions and JavaScript code. I pull both the import and export Octopus UK agile tariff prices once per day, and then turn this into a single tariff array which I store in Node-RED context for use as required.

As this thread is about the flex-table-card, I will just post the part of my flow that gets the agile import / export, turns these into one array, and stores it in Node-RED context. This array can be displayed in a flex-table-card as discussed earlier.

The part that you probably want is just the top sequence. Inject trigger to fire once per day, two API calls to Octopus to get the tariffs, change node to move msg.results to msg.payload and set the topic to import/export, a join node that puts both result objects into one object, and a bit of JSONata to get this into one array.

The saved array gets read back from context every 30 minutes to pull the current and next prices, and I also process the array into the best 15 (lowest/highest) import/export periods and combine consecutive groups into longer periods. This gets pushed to HA, where I can display the data.

I use the flex-table-card to show tariff prices as well as the best period groups.

Here is the part of the flow that gets both import/export into one array. Note that the API call is set for my region (the South West) and that I am using the most recent agile tariffs that I can find. Octopus are currently not offering agile tariffs, and as I am not using an agile tariff myself I had to hunt around to find the ‘current’ ones. I am pulling 48 hours worth of data (96 half-hour data points) so that my chart always shows at least today up to 23:00, and after 16:00 it will show both today and tomorrow.

[{"id":"db6ebccc4bb88b8d","type":"http request","z":"2dd6b0b4a5f86125","g":"e42010beae8f7fa5","name":"Octopus Export","method":"GET","ret":"obj","paytoqs":"ignore","url":"https://api.octopus.energy/v1/products/AGILE-OUTGOING-19-05-13/electricity-tariffs/E-1R-AGILE-OUTGOING-19-05-13-L/standard-unit-rates/?page_size=96","tls":"","persist":false,"proxy":"","insecureHTTPParser":false,"authType":"","senderr":false,"headers":[],"x":320,"y":1960,"wires":[["65094b21c3938d73"]]},{"id":"63bba87f93e0eaae","type":"http request","z":"2dd6b0b4a5f86125","g":"e42010beae8f7fa5","name":"Octopus Import","method":"GET","ret":"obj","paytoqs":"ignore","url":"https://api.octopus.energy/v1/products/AGILE-22-08-31/electricity-tariffs/E-1R-AGILE-22-08-31-L/standard-unit-rates/?page_size=96","tls":"","persist":false,"proxy":"","insecureHTTPParser":false,"authType":"","senderr":false,"headers":[],"x":320,"y":1920,"wires":[["22fdc0bfd7bdd329"]]},{"id":"65094b21c3938d73","type":"change","z":"2dd6b0b4a5f86125","g":"e42010beae8f7fa5","name":"Results","rules":[{"t":"set","p":"payload","pt":"msg","to":"payload.results","tot":"msg"},{"t":"set","p":"topic","pt":"msg","to":"export","tot":"str"}],"action":"","property":"","from":"","to":"","reg":false,"x":480,"y":1960,"wires":[["3c0e6412766b7286"]]},{"id":"22fdc0bfd7bdd329","type":"change","z":"2dd6b0b4a5f86125","g":"e42010beae8f7fa5","name":"Results","rules":[{"t":"set","p":"payload","pt":"msg","to":"payload.results","tot":"msg"},{"t":"set","p":"topic","pt":"msg","to":"import","tot":"str"}],"action":"","property":"","from":"","to":"","reg":false,"x":480,"y":1920,"wires":[["3c0e6412766b7286"]]},{"id":"3c0e6412766b7286","type":"join","z":"2dd6b0b4a5f86125","g":"e42010beae8f7fa5","name":"Combine","mode":"custom","build":"object","property":"payload","propertyType":"msg","key":"topic","joiner":"\\n","joinerType":"str","accumulate":false,"timeout":"","count":"2","reduceRight":false,"reduceExp":"","reduceInit":"","reduceInitType":"num","reduceFixup":"","x":640,"y":1920,"wires":[["416e22ecfcbf5616"]]},{"id":"0ba1d9b378092267","type":"inject","z":"2dd6b0b4a5f86125","g":"e42010beae8f7fa5","name":"@ 16:05","props":[{"p":"payload"}],"repeat":"","crontab":"05 16 * * *","once":true,"onceDelay":"2","topic":"","payload":"","payloadType":"date","x":140,"y":1920,"wires":[["db6ebccc4bb88b8d","63bba87f93e0eaae"]]},{"id":"416e22ecfcbf5616","type":"change","z":"2dd6b0b4a5f86125","g":"e42010beae8f7fa5","name":"Build & Save Tariff Array","rules":[{"t":"set","p":"payload","pt":"msg","to":"payload.import#$i.{\t   \"from\": valid_from,\t   \"upto\": valid_to,\t   \"date\": $substring(valid_from,0,10),\t   \"timefrom\": $substring(valid_from,11,5),\t   \"timeupto\": $substring(valid_to,11,5),\t   \"import\": value_inc_vat,\t   \"export\": %.export[$i].value_inc_vat\t}^(from)","tot":"jsonata"},{"t":"set","p":"OctAgileTariff","pt":"flow","to":"payload","tot":"msg","dc":true}],"action":"","property":"","from":"","to":"","reg":false,"x":830,"y":1920,"wires":[["56dd710454ea2e25"]]}]

I hope this is of some use.

2 Likes

Hi there,

I’m attempting to do the same league table as you. Could you please post your code for this? Thanks!

How to show multiline data:

Two examples below:

  1. Show any text below a value (could be a static text or a current time, for instance).
  2. Show 2 (or more) attributes’ values on different strings.
  3. Same as above + modifying values.

Also, check the last example from Using “div”, “span” & “ha-icon” for a header.

image

code
type: custom:auto-entities
filter:
  include:
    - entity_id: sun.sun
card:
  type: custom:flex-table-card
  columns:
    - name: ' '
      data: name
    - name: Elevation
      data: elevation
      modify: String(x) + "\nsome_text"
    - name: Elevation
      data: elevation, state
      multi_delimiter: <br>
    - name: Elevation
      data: elevation, state
      modify: >-
        var value1=String(x.split(' ')[0]);
        var value2=String(x.split(' ')[1]);
        value2.toUpperCase() + '\n' + value1*2;
  strict: true
  css:
    tbody tr:nth-child(1) td:nth-child(2)+: 'color: red; white-space: pre;'
    tbody tr:nth-child(1) td:nth-child(4)+: 'color: cyan; white-space: pre;'
1 Like