I have been experimenting with the integrated solar forecast myself. I have two planes (east/west), so I have set up the integration twice, and I am now also running my own hourly API calls in Node-Red to capture and manipulate the returned data myself. This totals four calls per hour, which is quite enough and allows for a small number of occasional additional test calls.
There is a lack of information on just what this integration is doing and how it works, and I believe that to make the best use of the data provided requires better knowledge of what is going on than is currently available. I don’t believe that it is giving away any great secrets to suggest that:-
- Yes, the integration calls the API internally once per hour, per integration. Integration entities are thus updated each hour.
- The (current) ‘free’ (there is no such thing as a free lunch) account allows 12 API calls per 60 minute period (I don’t know if this is a fixed or rolling period).
- The integration triggers API calls ‘randomly’ (but I think I know on what basis). Clearly, from a ‘free use’ point of view, the provider of forecast.solar would much rather calls be random than everyone calling at xx:01 past each hour…
- The API call provides a full hourly array of forecast power (watts) for each hour, on the hour, for today and tomorrow. Watt-hour values are provided for each hour-period, but can easily be calculated from the average between two hour values. [say 1200 watts at 11:00 and 1500 watts at 12:00, assume straight line, average 1350 across the hour = 1350 watt-hours]
- The integration seems to pick out certain items, such as ‘power now’, which is for the current hour from the returned array (and +1 hour, +12 hours, +24 hours). It also adds together both (all) integrations and uses the provided values to update the graph.
To address your point on pull rate. Tracking the forecast every hour I notice that the figures change, which of course is to be expected, but the figure for a given hour can often be the same for several hours in a row. I don’t think that updates more than once per hour would provide any real value in terms of better data, indeed I wonder if I need call the API only every other hour. However, there remains the issue of the xx:02 versus xx:58 update challenge. This really comes down to an integration issue. Rather than increasing the number of calls to forecast.solar, I think the integration could offer improved provision of the existing data.
Ideas are
- expose the full forecast array in HA, thus avoiding the need for additional calls and allowing for direct use of the data as each user thinks fit
- better expose the ‘random’ update time. Use this time to shift the values (ie if between hour and half hour, values are as is, if between half hour and next hour, shift ‘power now’ to next hour, ‘power next hour’ to +2 hours and so on. This is, of course, possible now by capturing the integration entity update time and shuffling between power 0, +1 forecast figures
I am mindful that we are benefiting from the good work done by the HA team, whoever added this integration, and of course the work and ongoing (free) provision of Forecast.solar.

I have set up a template sensor ‘solar_forecast_nexthour’ which adds together the next hour entity for my two integrations (planes). Here is a standard HA history graph, showing that my current integration update is at 20 minutes past the hour, and that the data is changing - but that is because each hour is changing. The randomness of the integration update just slides this graph to the right by 0-59 minutes.
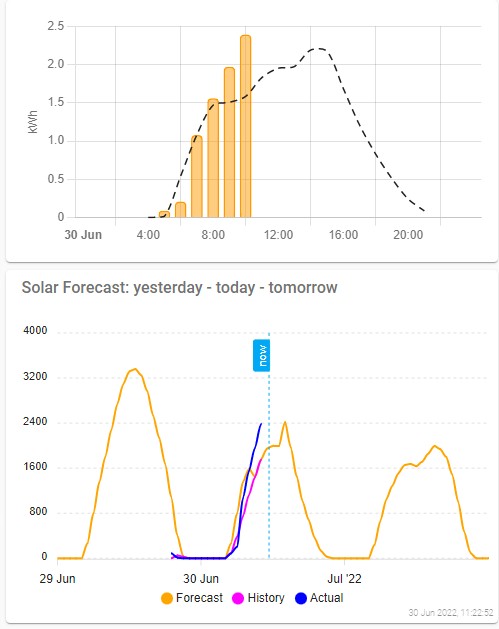
Here is my own solar forecast graph, using direct API calls in Node-Red. At the top is the standard integration - solar forecast as dotted line, just updated (picture taken at 22 mins past the hour). Below, my own graph. Today is in the middle, left is ‘yesterday’ right is tomorrow. The orange line is the data from forecast.solar. Today and tomorrow are updated every hour, and therefore what you see tracks the most recent data update. I capture the output array into my own array, which is moved left every new day, thus ‘yesterday’ is the forecast for what was today as at 23:xx last night. The blue line is actual generation, taken from an hourly-reset utility meter sensor on my inverter output sensor, capturing the total power at the end of each previous hour.
Of interest to the topic in discussion is the magenta line, recently added. Here I additionally push (each hour) just the current hour forecast value to another array, so as to track what the forecast value was at the point of ‘now’. You will notice that the orange line starts to move away (upwards) from the magenta line when around two hours old. This is an interesting ‘feature’ of the forecast - I assume that the forecast is based on clear sky values (for location/orientation/size) degraded by ‘weather’. As the forecast array continues to be updated (each hour) having moved into ‘history’ the weather element goes and the forecast seems to revert towards a theoretical maximum. I reset the data last night, but I can confirm that the ‘as was’ forecast and my ‘actual’ for yesterday matched quite well, and that the current ‘yesterday forecast’ is quite different.
This may seem to be of academic interest only, however the integration provides ‘peak time today’ and ‘total energy today’ values, which are updated hourly from the full today forecast - once we start to get into today, and the back-history forecast starts to change, these values typically become increasingly unreliable. I also have difficulty in matching my API based graph to the integration forecast line.
Rather than getting ‘new data’ sooner, I believe the real challenge lies around trying to use what is provided in the most appropriate way.