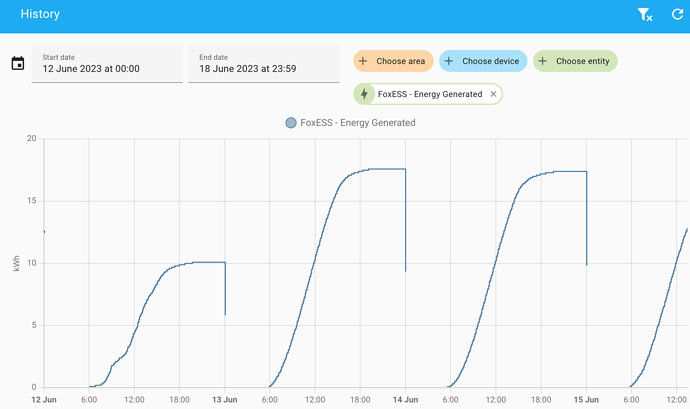
Can anyone shed light on why the Foxess - Energy Generated daily sum values appear to drop on a history graph at midnight every night (inverter shuts down at 9pm)?
It’s stats between 9pm & 5am next day are all recorded as zero (correctly). All currently sourced via Foxcloud (pending modbus)
This is completely normal.
Energy stats are created as Utility Meter (‘kWh’), based on integral sums (e.g. Riemann sum integral sensor) based on the instant power reading (usually ‘kW’).
Those are generally set to reset Daily but you can create a new one an base it on the same sum sensor and select the refresh period you prefer.
Just for context, what integration is this sensor based on? Just read your post better, it’s the “Foxcloud”.
In this case, the “sum approach” wouldn’t really work because the time interval between samples is too high (~5min), this wouldn’t be enough to generate an accurate meter sensor.
You are stuck with this for now, until you can sort your Modbus out.
I thought that might be the case but there is also a difference in the graphs for the same entity!
1st graph from the entity history - this doesn’t show the drop at midnight
and 2nd graph from history screen (same entity but shows a drop at midnight every day
Again, completely normal.
What you see is a “defect”, a glitch in the graphical interface, that doesn’t handle well sources when there is sudden change or, worse, they go unavailable. The Utility Meters are renown for doing this, especially because they generally became unavailable until the first value is generated again, and this is usually in the first minutes of sunlight in the morning, when it comes to the “generation” one.


