Hoping to get some guidance as I’m not really sure where to start.
I have a Fronius grid tied solar PV inverter integrated into HA, and it also populates the Energy tab.
I also have InfluxDB and Grafana and have a rudimentary understanding of both (enough to generate some charts plotting a few things).
One thing I am wanting to do is collect some stats on the operational status of my inverter. One entity (a sensor) is the current error code status.
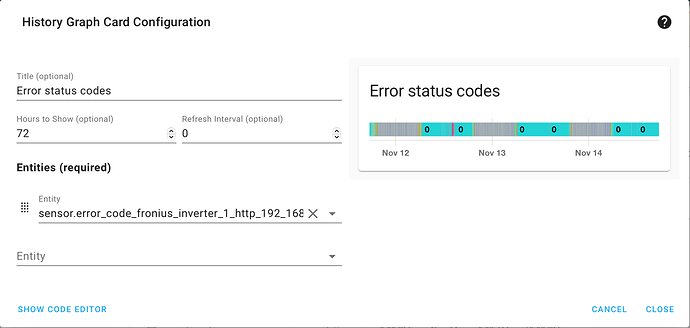
The configuration looks like this:
It will return a code number, e.g. “0”, or “567” or “202” etc depending on current status code. A basic History Graph Card plots these status codes via colour coding in a bar chart. It’s quite neat as I can see when certain states occur however it is also ephemeral. I’d like to collect the data long term and be able to extract stats from it.
I am particularly interested in collecting statistics on one code, state 567, which indicates a grid over voltage scenario and the inverter running in a special mode related to that.
I want to know how often and for how long the inverter is in this state.
But I have little idea where to start.
Any pointers?
Many thanks.
