Hello,
I would like to display the gas consumption of a day (for example today or yesterday) on the dashboard.
I found different possebilities, but got none of them working…
For example history stats. I tried to setup something like:
- sensor:
  - platform: history_stats
    name: Todays Gas consumption
    entity_id: sensor.gasmeter_kwh
    state: "on"
    type: time
    start: "{{ now().replace(hour=0, minute=0, second=0) }}"
    end: "{{ now() }}"
But whats the correct “state” for that? “On” doesn’t seem right (and doesn’t work).
I tried to use a Utility Meter:
config.yaml:
utility_meter:
  util_gas_consumption:
    source: sensor.gaszaehler_kwh
    name: Gas
    cycle: daily
ui-lovelace.yaml:
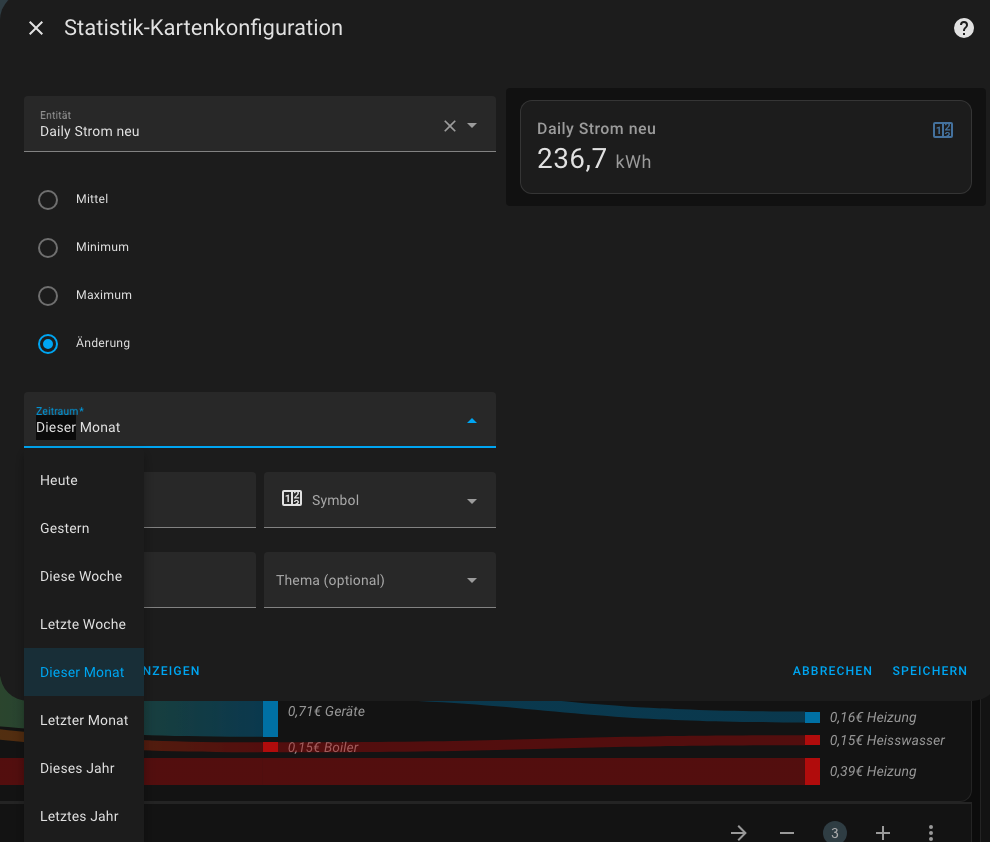
  - type: statistics-graph
    chart_type: bar
    period: day
    days_to_show: 14
    entities:
      - sensor.util_gas_consumption
    stat_types:
      - change
But it only shows “no statistics found”.
Whats the right way to do it?