Let me answer to my own question.
I didn’t found a way to access grafana over nabu casa but I did find a way to display grafana dashboards over nabu casa. It is not perfect but it is working. I done my setup mostly based on this post. Obviously using grafana image render plugin can display grafana dashboards as a picture. Not maybe perfect but it is working.
docker-compose.yml
 ### grafana
  grafana:
    image: grafana/grafana-enterprise:latest
    container_name: grafana
    ports:
      - 3000:3000
    environment:
    - TZ=Europe/Zagreb
    - GF_AUTH_BASIC_ENABLED=true
    - GF_AUTH_DISABLE_LOGIN_FORM=true
    - GF_AUTH_ANONYMOUS_ENABLED=true
    - GF_AUTH_ANONYMOUS_ORG_ROLE=Admin
    - GF_SECURITY_ALLOW_EMBEDDING=true
    - GF_RENDERING_SERVER_URL=http://192.168.8.40:8091/render
    - GF_RENDERING_CALLBACK_URL=http://192.168.8.40:3000/
    - GF_LOG_FILTERS=rendering:debug
    healthcheck:
      test: curl --fail http://192.168.8.40:3000/ || exit 1
      interval: 15s
      timeout: 1m
      retries: 2
    volumes:
      - /opt/grafana:/var/lib/grafana
    user: "root"
    depends_on:
      - influxdb
    restart: always
### grafana render
  renderer:
    image: grafana/grafana-image-renderer:latest
    container_name: grafana-render
    ports:
      - 8091:8081
After some tries I found that this setup is working for me.
In configuration.yaml add
### Grafana image
shell_command:
  download_grafana_image: '/bin/bash /config/scripts/download_grafana_image.sh'
Create dashboard in grafana, select share and use direct link rendering image. It will open new tab and display whatever you done in grafana. Copy that url.
Create directory scripts, if you don’t have it, and inside that directory create file download_grafana_image.sh with content:
#!/bin/bash
curl -s "URL_you_copied_from_above_refresh=5s&from=24h&to=now&panelId=1&width=1600&height=400" -o /config/www/grafana/my:dashboard_picture.png
Go to the script directory and make file download_grafana_image.sh executable with chmod +s *.sh
Make sure that directory /config/www/grafana exist. If it doesnt create it.
Configure width and height to suit your needs.
Create automation that will call a script every minute or so and do picture update, something like this:
alias: Download grafana image
description: ""
trigger:
  - platform: time_pattern
    seconds: "30"
condition: []
action:
  - service: shell_command.download_grafana_image
    metadata: {}
    data: {}
mode: single
Check if this is working by running automation and checking if png file is created in grafana directory.
If everything is working you add
camera:
  - platform: local_file
    name: Grafana_elecricity_current
    file_path: /config/www/grafana/electricity.png
After restart home assistant you should have a new camera image.
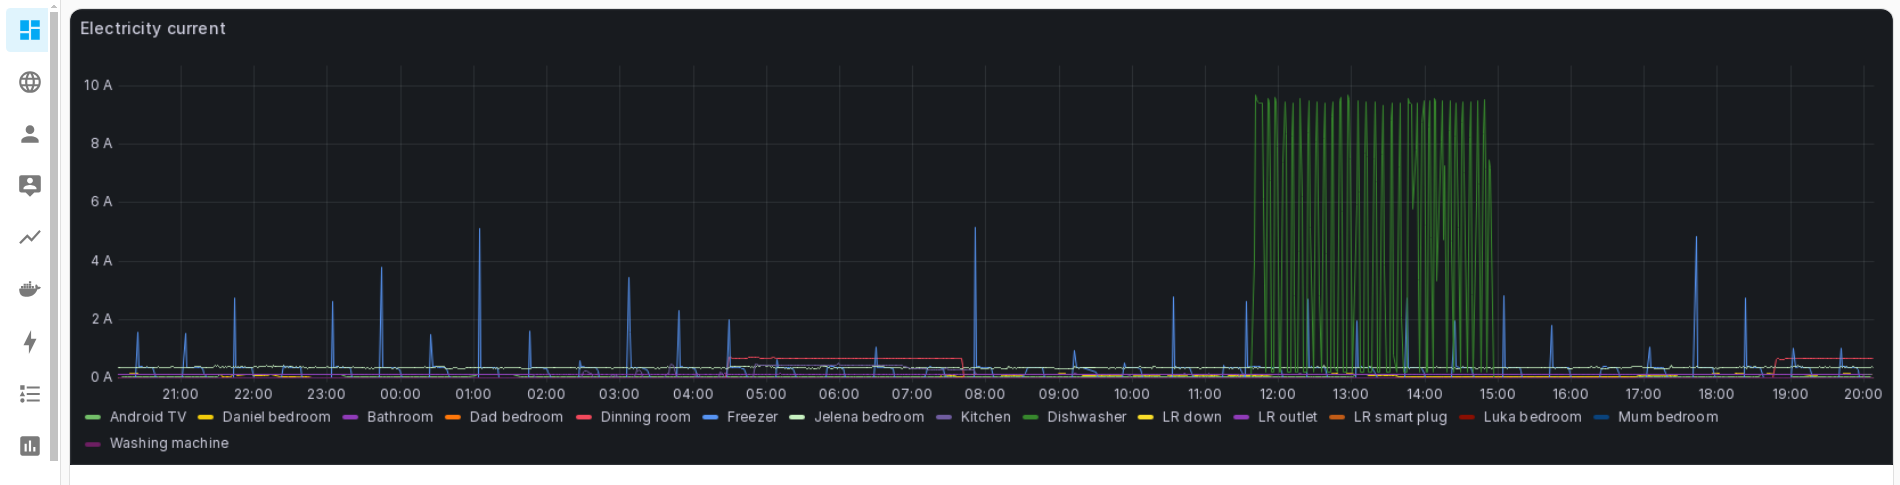
This is how it looks on a first try