Hi all,
I have a HA Yellow, InfluxDB and Grafana installed and working well. I’ve build a few dashboard like this one
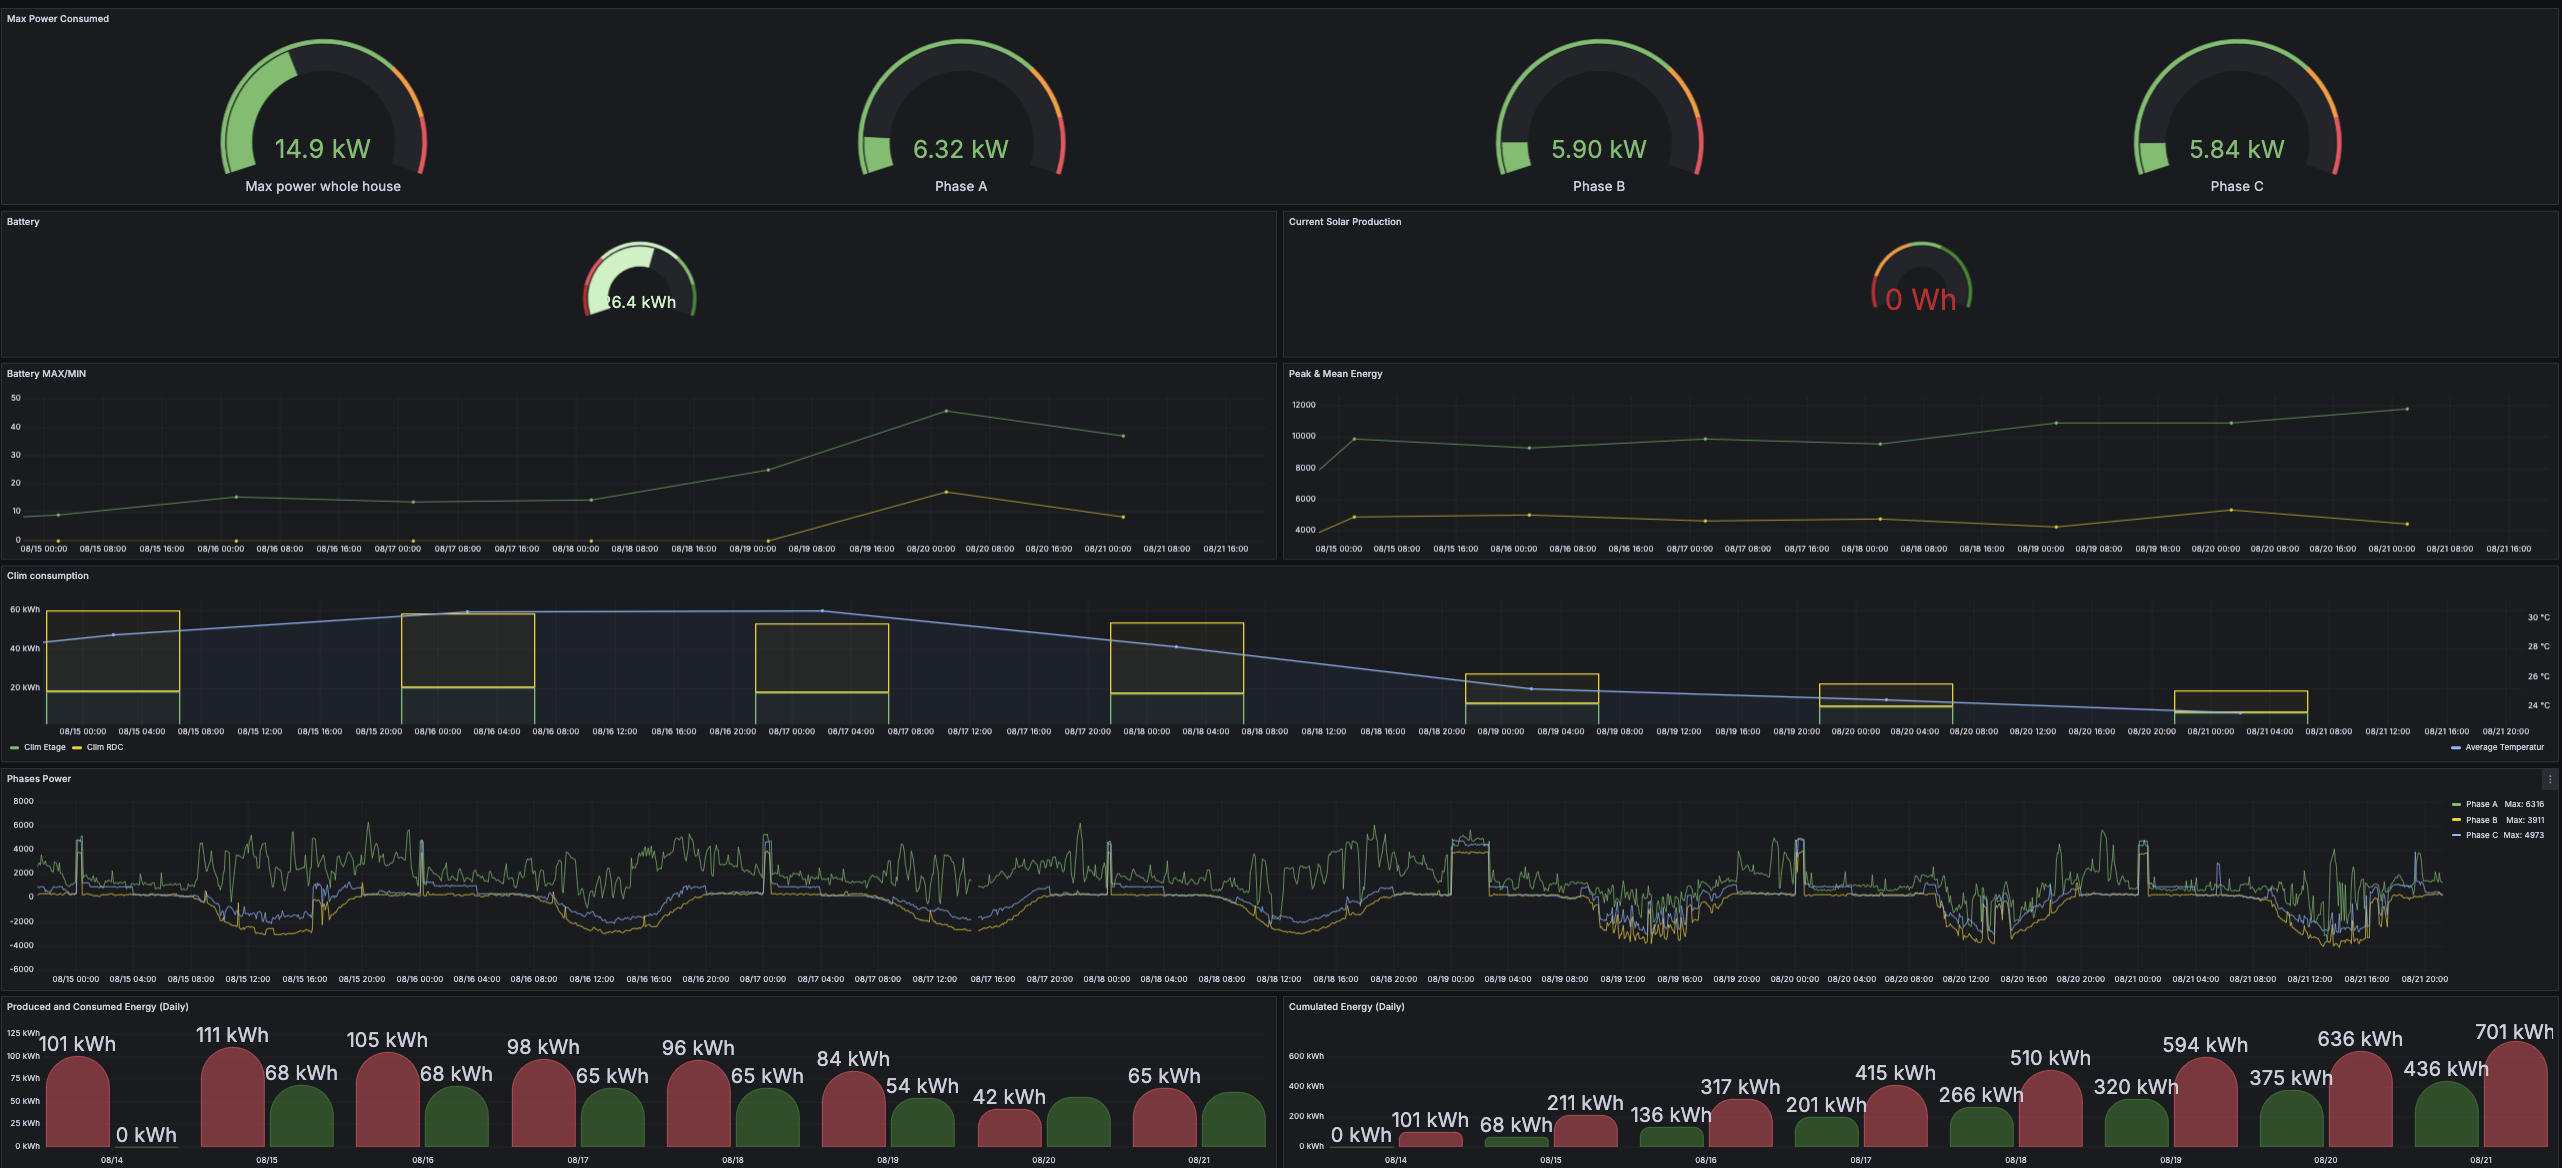
and would love to expose them on the HA dashboard to be able to view some info quickly on my home tablet.
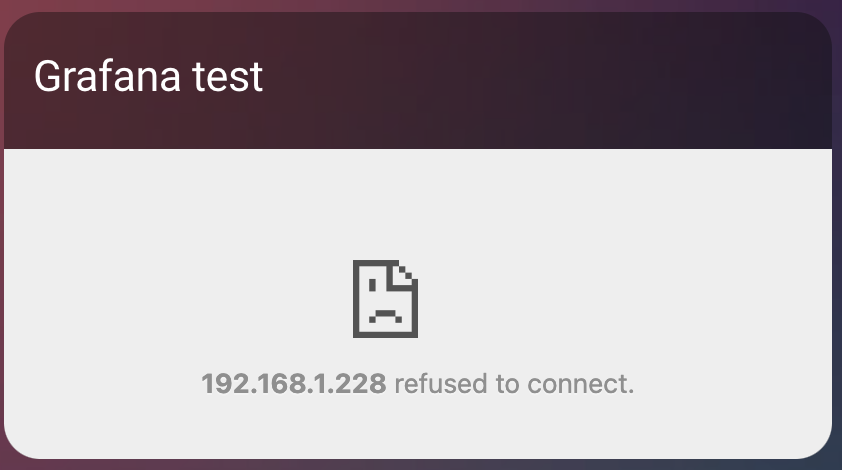
I’ve create a iFrame card and copied the URL provided by “Share” option ( already tried all variants)
But all I got is this :
YAML of the iFrame hereafter :
type: iframe
url: >- http://192.168.1.228:3000/api/hassio_ingress/6lQfo_91fAQxDDQ0MV3sSgeI1aG7JBrd5VWq9Kgpny4/d/b880fada-3188-4182-bf6d-6b9e9d644750/energy?orgId=1&from=now-7d&to=now&timezone=browser&refresh=15m
aspect_ratio: 75%
title: Grafana test
PS: I’ve tried already a lot of combination (localhost, shorturl, …)
I’ve already tried to update the Grafana config and add :
- name: GF_AUTH_ANONYMOUS_ENABLED
  value: "true"
- name: GF_AUTH_ANONYMOUS_ORG_NAME
  value: Main Org.
- name: GF_AUTH_ANONYMOUS_ORG_ROLE
  value: Admin
- name: GF_SECURITY_ALLOW_EMBEDDING
  value: "true"
- name: GF_AUTH_DISABLE_LOGIN_FORM
  value: "true"
restarted the addon but no luck.
Gemini, ChatGPT and even Deepseek also failed to help.
Anyone got an idea on what magic we need to apply to get HA to display a Grafana dashboard?
Thanks in advance
Fred