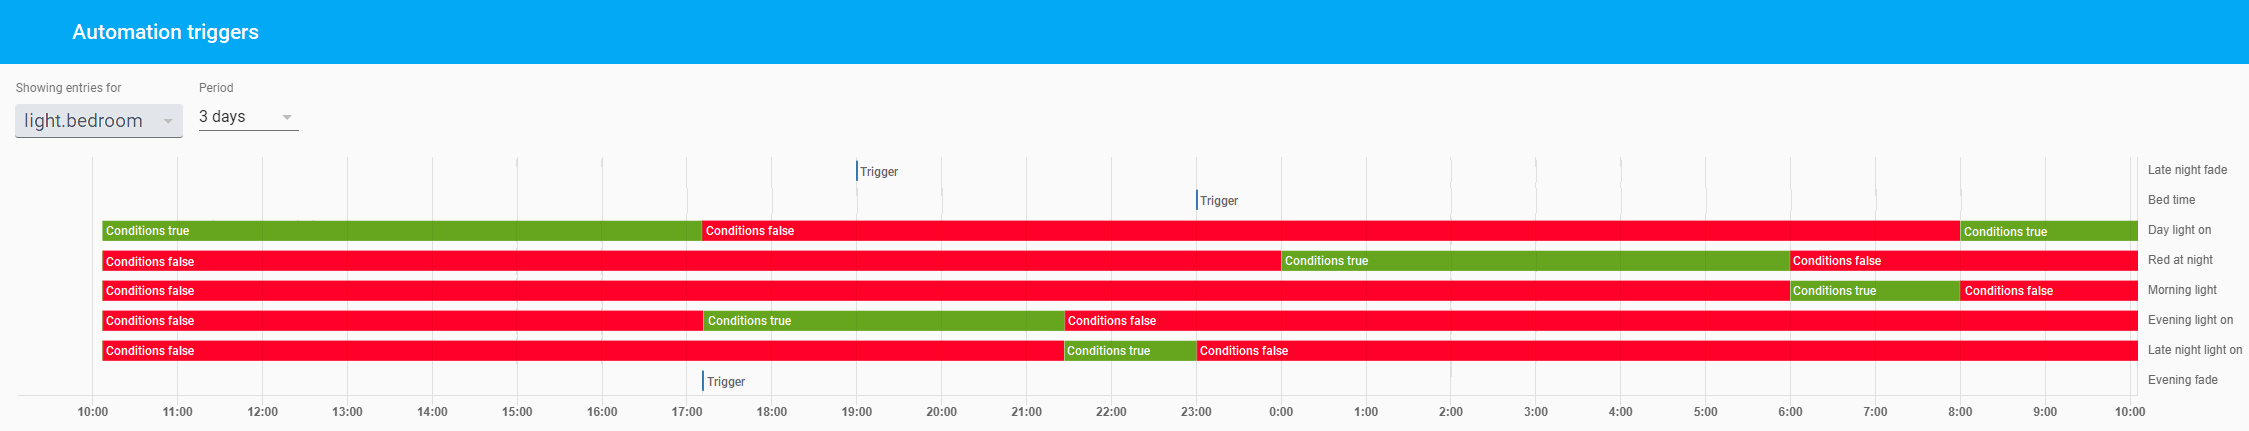
I feel it would be nice to have a place where you can view all your automation conditions and triggers that are time based in a simple timeline view similar to history. This would be especially useful when you add or edit a bunch of automations and want to make sure they don’t clash, without having to open up each individual automation.
I whipped up a picture of what it could look like.
What I did is I actually added input_text to each of my automations that describes status of automation while it executes (e.g. irrigation zone 1 started, irrigation zone 2 started, … irrigation complete) and I change its value from iside automation itself. Then I added these to history. This way I can see on history graph how automations are working. Obviously it is history only, not how these are scheduled…