Hello dear HA enthusiasts!
I am looing for a Lovelace config to visualize some Stock Market Values. For the values I am using a custom component called “Avanza Stock” and “yahoo finance”. So far they are working good for single values or stocks, but I would also like to have an overview of the world wide financial situation.
During my search I crossed this site (https://www.tradingview.com/widget/) which offers widgets.
As a new user of HA I was wondering: is it possible to add the offered code of tradingview.com to a lovelace configuration and if so how? In general that would be an instreting thing to know, since I stumble over farious intresting widgets from time to time.
So far I found out, that I can not natively display html inside lovelace, so I was using a custom component card for that: https://github.com/PiotrMachowski/lovelace-html-card
Unfortunately the card can not display Java Script. So I think my follow up question is: how to use Java Script in Lovelace?
Hey!
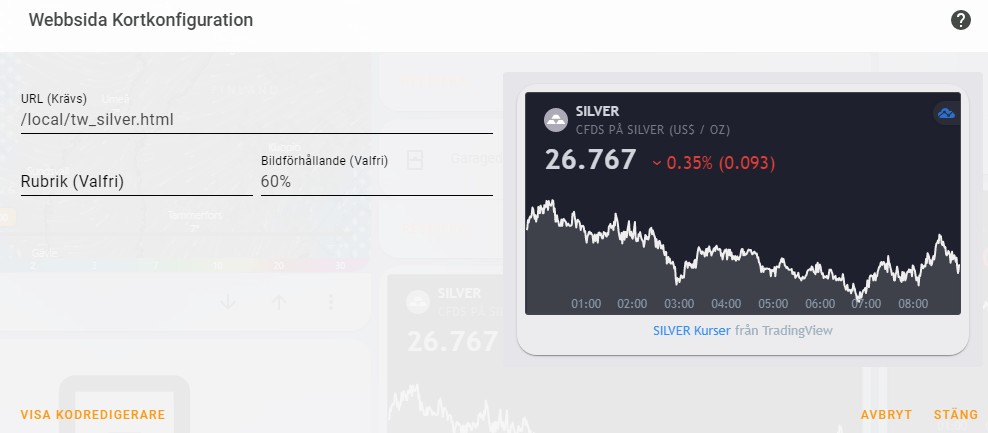
My solution looks like this. Has worked perfectly.
Create a file that you add to the directory www (if you do not have that directory, add it). My example, /config/www/tw_silver.html
In that file, add the HTML code generated by Tradingview. Save.
You may need to restart HA
Then add a card to the lovelace configuration of the web page type. URL /local/tw_silver.html
can you please share your “tw_silver.html” file?
I’d love to add that to my HA ![]()
Thank you for sharing.
- Go to Mini Chart Widget — Free and Powerful Tool — TradingView (you might need to sign up for a free account)
- Modify the fields and click Apply
- The generated HTML is at the bottom of the page
- Copy that HTML to a file at /config/www/trade_stocksymbol.html (substitute relevant symbol)
- Lovelace - Add webpage card and use /local/trade_stocksymbol.html
- Profit
Hope that helps. Good luck.
I couldnt work out how to change the background though.
Assuming the same applies to other html code, what am I missing with either weatherwidget.io or theweather.com? Neither displays anywhere near correctly if I follow the same approach. Sorry, I know nothing of html.
Looks nice - thank you.
For more than one chart it’s too expensive though.