Here is a short guide to how I’ve organised monitoring of (electrical) energy consumption in HA. The main objective here was being able to
- track usage by category of device
- reduce glitching in the data and allow me to add/remove devices without losing historical per category data
- running averages for e.g. the last 30days’ consumption instead of the utility_meter’s tracking of e.g. this month, which is not so useful on day 3 of the month.
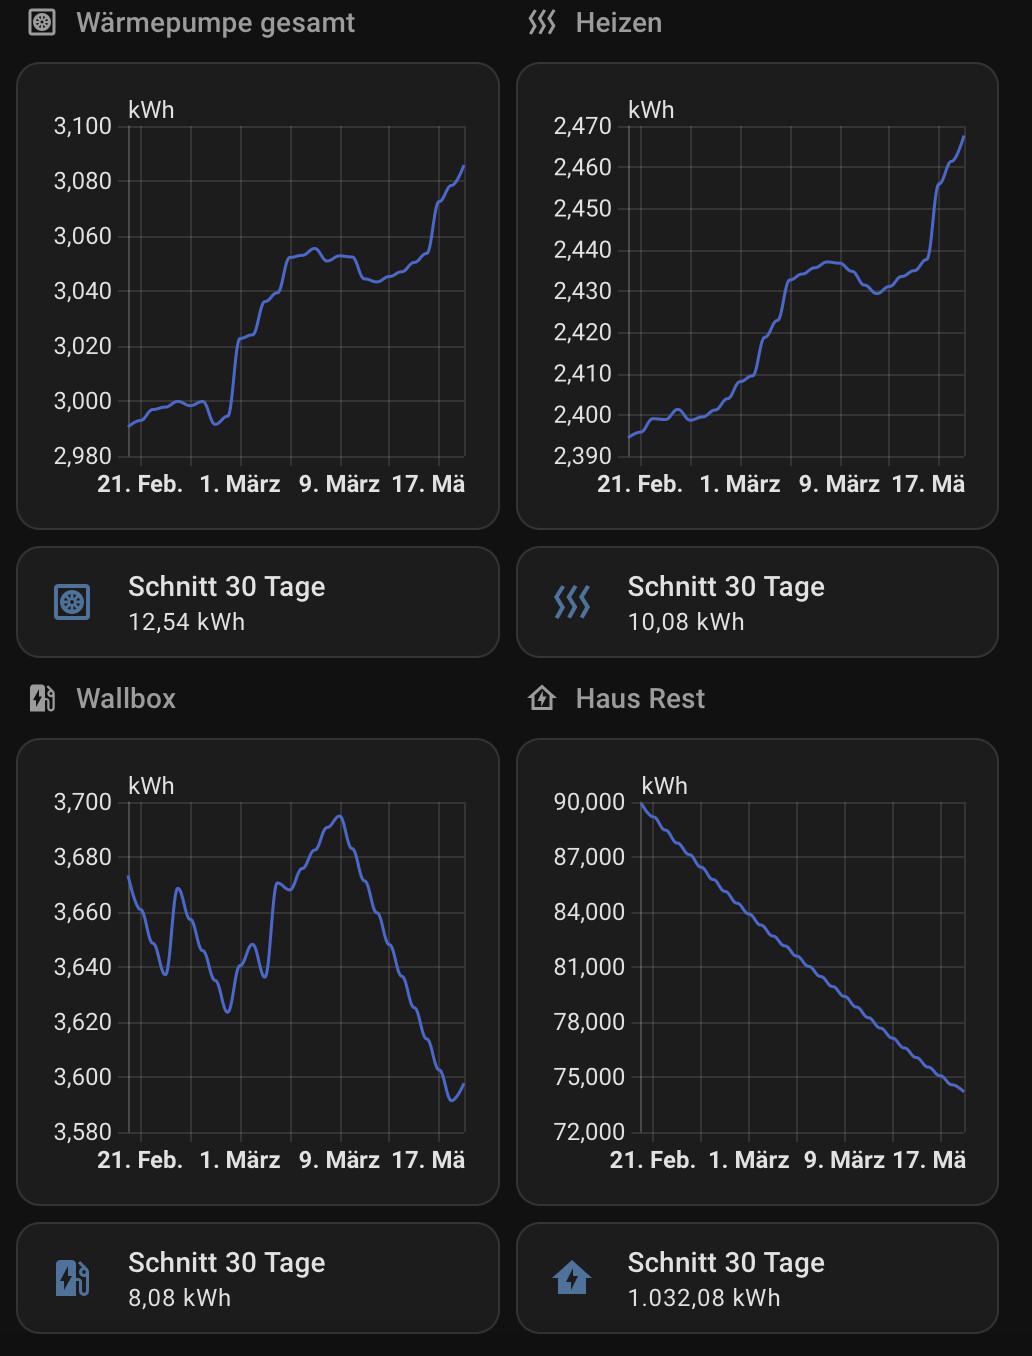
What I’ve ended up with is something that looks like this:


Doing this requires some hardware investment and it will probably never save you as much money as you will spend on it, but it will allow you to make (more) informed decisions about optimising your energy use. Note that my estimate of the precision of the various energy meters built into IoT devices is around 10%, so there isn’t much point in trying to worry about precision since the accuracy will never be there.
The guide is divided into four parts:
- monitoring individual devices
- clustering devices into categories without glitches
- running averages
- displaying it in the dashboard
Monitoring individual devices
Total consumption
I will stress here that you want to have some way of monitoring total consumption – be it using a smart meter integrated into HA, something like a Shelly em3 installed in your fuse box or a website of your electricity company. Unless you do this, you will never really know if the other devices you’re monitoring are 90% of your consumtion or just 20%. I would start here.
Smart plugs
Many smart plugs (though not the cheapest ones) come with power/energy monitoring. I’ve put these at the sockets of the most expensive devices – the fridge, oven, dishwasher etc. Especially for variable-power devices this is the only reasonably accurate way of tracking energy use.
I never use the smart plug capability here, but you can make these devices semi-smart by monitoring the power usage and count e.g. how many dishwasher cycles you’ve run since you cleaned it last time.
I’ll note here that usually there is a power meter and sometimes an energy sensor exposed in these devices. Use the energy sensor if you have it, instead of integrating the power in HA through the Riemann sum helper, since it’s likely to be more accurate.
There is also the Emporia Vue 2 monitor which you can put in your fuse box and monitor many circuits in your home. Alternatively, you can put more Shelly’s in your fusebox to monitor particular circuits, e.g. AC or the induction stove.
Energy sensors in integrations
Some smart devices report energy use as part of their integration (e.g. some of the smart washing machines or AC units). You get all the info you need.
Powercalc
There is a HACS integration called Powercalc, which creates power/energy sensors for devices it has in its database (e.g. many smart lightbulbs), but also allows you to programme the energy use profiles for your devices. This was if you can track the status of a device in HA (e.g. your vacuum cleaner), you can use one smart plug to measure the consumption in the various states and create a sensor tracking the energy. Things that have reasonably stable power consumption if the state is known (e.g. TVs, routers, lights) if they have the state available to HA can be estimated well.
Summary
You do need smart plugs for devices which are major consumers and do not have their state available to HA, or the power draw is unstable (my amplifier for example – varies like crazy). If HA knows the state, or something is always on, you can measure and calculate the power/energy use.
Clustering into categories
I have divided all my devices into six categories
- Cooking - stove, oven, coffee maker, fridge
- Climate - AC, electrical heaters, extractor fans
- Cleaning - dryer, washer, dishwasher, vacuum
- Lights - lightbulbs and light switches operating multiple bulbs
- IT – office computers, router, HA and all the IoT stuff like cameras
- Media – TV, music players
- Uncategorised
in descending order of importance for our household.
Initially I just created category template sensors summing each of the energy sensors of the devices and made their state_class total_increasing. However, over time this led to issues:
- sometimes the sensors would glitch and I would get a +1000kWh spike, followed by a symmetrical return to the initial value. Since the sensors was total_increasing, the down would not get ignored
- a few devices failed and became unavailable, making the whole sum sensor unavailable. You could remove them, but the new sum would be lower than the state before
- I’ve repurposed a few smart plugs changing categories – again, moving them would change the state of the sum sensors.
To solve this, I’ve created a template sensor which always sums the increase/decrease of the monitored devices and saves their last-known good state in its attributes, allowing it to be always available and to reject bad states of the monitored sensors. Over the last year this has given me stable sensors for the categories. Here is the yaml for such a template sensor
- sensor:
    - name: Electricity total Energy
      unique_id: "roigjoreoifnofnvo"
      <<: &cumulator_sensor
        icon: mdi:lightning-bolt
        device_class: energy
        unit_of_measurement: kWh
        state_class: total_increasing
        state: >-
          {% set current = this.state if this.state | is_number else this.attributes.get('last_good',{}).get('self',0) %}
          {% if to_state_add | is_number and to_state_sub | is_number %}
            {% set to_state = to_state_add|float - to_state_sub|float%}
            {% set from_state = this.attributes.get('last_good',{}).get(trig_ent,to_state)|float%}
            {{(current|float + to_state - from_state)|round(3) if (from_state|abs < to_state|abs < from_state|abs + 2)  else current}}
          {% else %}
            {{current}}
          {% endif %}
        attributes:
          last_good: >-
            {% set last_dict = this.attributes.get('last_good', {}) %}
            {% if pass and to_state_add | is_number and to_state_sub | is_number %}
              {% set to_state = to_state_add|float - to_state_sub|float%}
              {% set last_dict = dict(last_dict,**{trig_ent: to_state}) %}
            {% endif %}
            {% set last_dict = dict(last_dict,**{'self': this.state|float}) if this.state | is_number else last_dict %}
            {{last_dict}}
  trigger:
    - entity_id:
        - sensor.electricity_a_energy_returned # AC installers flipped the A clamp
        - sensor.electricity_b_energy
        - sensor.electricity_c_energy
        - sensor.ac_all_energy # circuit not threaded through shelly, must be added separately
      <<: &cumulator_trigger
        platform: state
        not_to:
          - "unknown"
          - "unavailable"
          - "None"
        variables:
          pass: "{{true}}"
          to_state_add: "{{trigger.to_state.state}}"
          to_state_sub: 0
          trig_ent: "{{trigger.to_state.object_id}}"
    - entity_id:
        - sensor.electricity_a_energy # AC installers flipped the A clamp
        - sensor.electricity_b_energy_returned
        - sensor.electricity_c_energy_returned
      <<: &cumulator_trigger_negate
        platform: state
        not_to:
          - "unknown"
          - "unavailable"
          - "None"
        variables:
          pass: "{{true}}"
          to_state_add: 0
          to_state_sub: "{{trigger.to_state.state}}"
          trig_ent: "{{trigger.to_state.object_id}}"
This sums the three energy sensors from the Shelly em3, montoring each of the three phases. The Shelly rather ridiculously needs to be reset to reconnect to WiFi which loses its state. This total sensor can ignore this reset.
You will notice the YAML anchors here, e.g. <<: &cumulator_sensor. This then allows me to define sensors based on this one for the other categories, without repeating the code:
- sensor:
    - <<: *cumulator_sensor
      name: Cooking all Energy
      unique_id: "4899e8eo8utpnw34tpv3y8t472y"
  trigger:
    - <<: *cumulator_trigger
      entity_id:
        - sensor.plug_kitchen_coffee_electric_consumption_kwh
        - sensor.plug_kitchen_fridge_electric_consumption_kwh
        - sensor.plug_kitchen_microwave_electric_consumption_kwh
        - sensor.plug_kitchen_oven_energy_cumulative
        - sensor.kitchen_cooker_total_energy
        - sensor.plug_kitchen_kettle_energy
        - sensor.plug_kitchen_mikser_electric_consumption_kwh
The anchors allow me to just specify the sensors I want to track and the name of the category sensor and that’s it. I have such sensors for each of the six categories and then the uncategorised sensor is just the diffence between the total sensor and the six categories – it fluctuates up and down around some mean, so it is best left this way.
- sensor:
    - name: Electricity Uncategorised Energy
      icon: mdi:flash
      device_class: energy
      unit_of_measurement: kWh
      state_class: total
      unique_id: "rpitu3t3m94ut3eruterofnvo"
      state: >
        {% set total = 936.949 + 12.05 + states('sensor.electricity_total_energy')|float
          - states('sensor.climate_all_energy')|float
          - states('sensor.cleaning_all_energy')|float
          - states('sensor.cooking_all_energy')|float
          - states('sensor.media_players_all_energy')|float
          - states('sensor.it_network_all_energy')|float
          - states('sensor.lights_all_energy')|float%}
          {{total|round(3)}}
      availability: >
        {{ states('sensor.electricity_total_energy')| is_number
          and states('sensor.climate_all_energy')| is_number
          and states('sensor.cooking_all_energy')| is_number
          and states('sensor.cleaning_all_energy')| is_number
          and states('sensor.media_players_all_energy')| is_number
          and states('sensor.it_network_all_energy') | is_number
          and states('sensor.lights_all_energy')| is_number }}
There are some numbers there in the total to set the initial value to something sensible. These sensors are the ones you want to use in the Energy dashboard.
Running averages
What I want to know and HA does not easily provide is the typical energy use over some period, e.g. 30days, so that you can average out the fluctuations of daily life (10 loads of laundry in one day after nothing for a week). The problem is that the recorder keeps data for 10 days by default and it doesn’t make much sense to extend this for all the entities, nor explictly worry about not recording new entities.
Thankfully template sensors with state_class measurement and total have their state saved into the long-term statistics (LTS) database once per hour. We can access this using the SQL integration. I have created SQL sensors for each of my categories computing the averaged difference in the state between now and e.g. 30 day ago. It looks like this:
sql:
	- name: Electricity total Energy l30d
	  unit_of_measurement: kWh
	  unique_id: xxw4i34p98tj3498ty34r
	  query: >
		SELECT
		  (SELECT
			statistics. Sum
		  FROM
			statistics
			INNER JOIN statistics_meta ON
			  statistics.metadata_id=statistics_meta.id
			WHERE
			  statistics_meta.statistic_id='sensor.electricity_total_energy'
			ORDER BY statistics.start_ts DESC
		  LIMIT 1)
		-
		  (SELECT
			statistics. Sum
		  FROM
			statistics
			INNER JOIN statistics_meta ON
			  statistics.metadata_id=statistics_meta.id
			WHERE
			  statistics_meta.statistic_id='sensor.electricity_total_energy'
			AND
			  statistics.start_ts > UNIXEPOCH("now","-30 days","-1 hour")
			LIMIT 1)
		AS change
	  column: change
	  value_template: "{{(value/30)|round(2)}}"
You need to know a bit of SQL to unpack the query, but heuristically: the statistics database keeps the LTS records – the important column there is called .sum. The states of the individual sensors are labelled by the .id column. The relation between the entity_id and the id in the LTS databse is kept in the statistics_meta database. The quesry therefore first identifies the id of the sensor named sensor.electricity_total_energy and then finds the difference in the sum column between the last entry (ORDER BY statistics.start_ts DESC) and the entry from 30 days ago statistics.start_ts > UNIXEPOCH("now","-30 days","-1 hour"). The value_template key then divides this by 30 to get a per-day energy use.
These sensors are the ones you want to use for the pie charts.
Displaying it in the dashboard
Energy dashboard
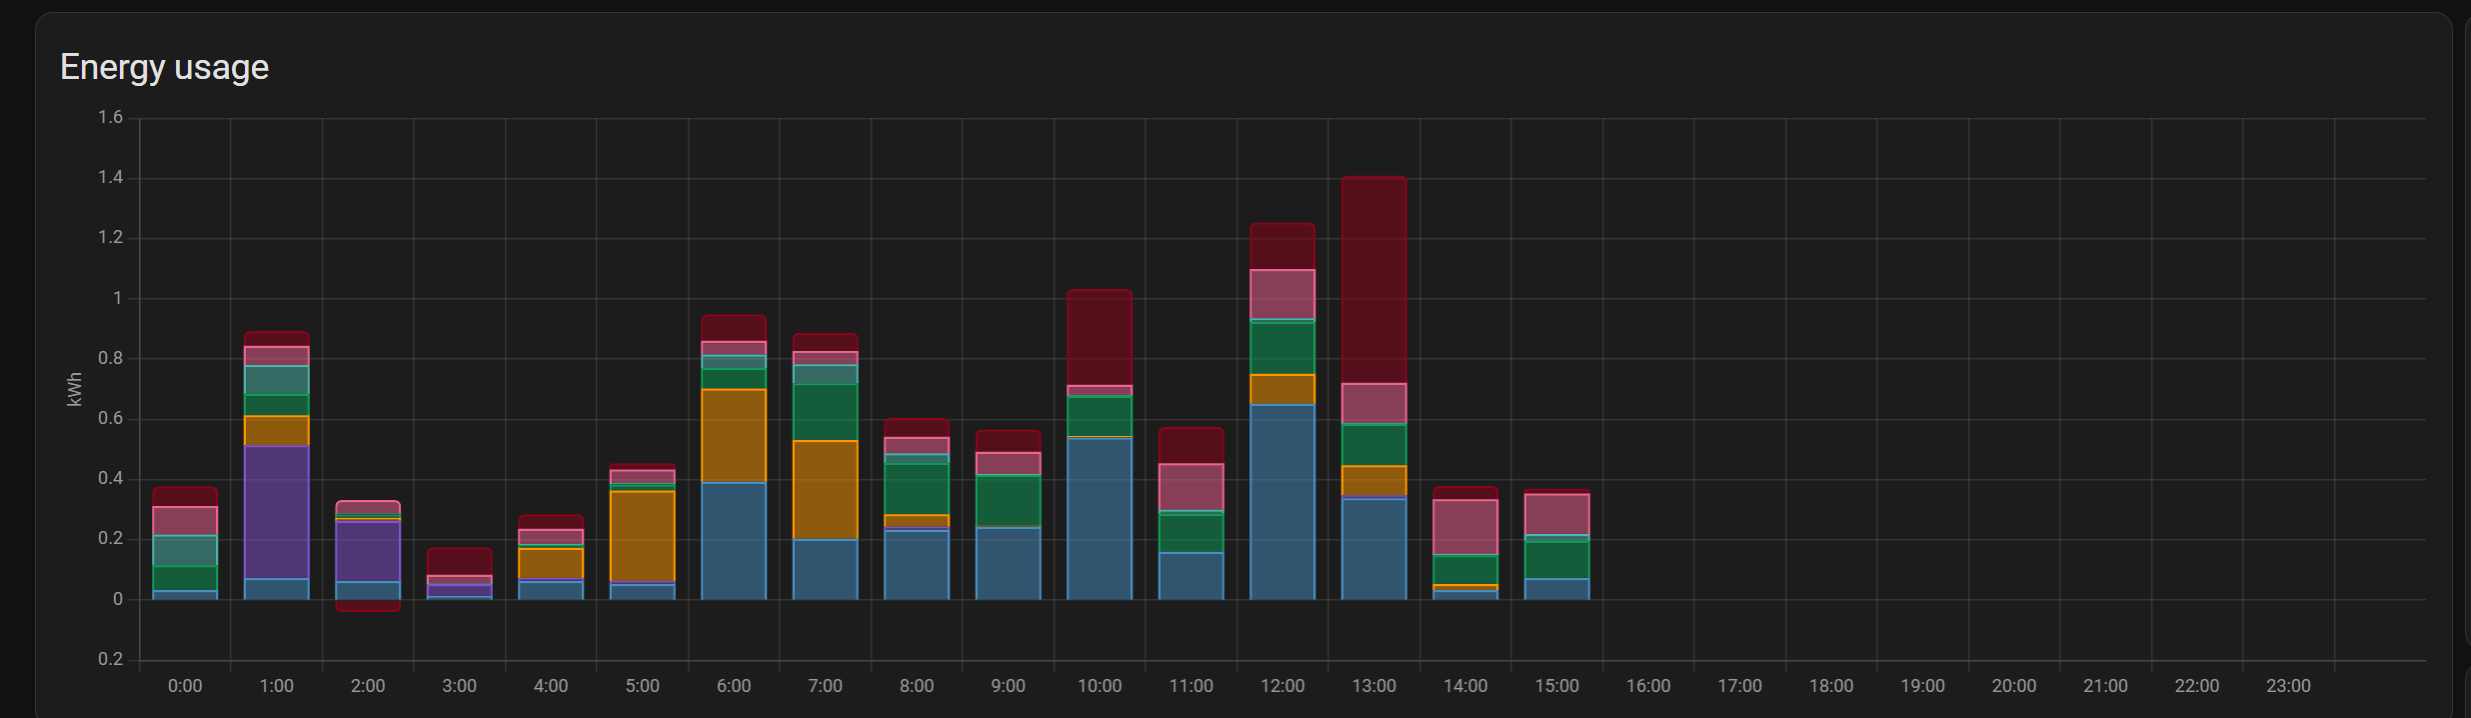
I have abused the Energy dashboard a bit to get what I want. I am using each of my category energy sensors as Grid consumption. This gives me the split into the different energy use over periods in the dashboard and the stacked bar charts

By default, the energy dashboard chooses colours that are nearly the same for each of the grid consumers (since it tries to differentiate between consumption and production). I have therefore edited the colour scheme by defining a theme in configuration.yaml:
frontend:
  themes:
    good-bars:
      modes:
        dark:
          energy-grid-consumption-color-0: "#488fc2"
          energy-grid-consumption-color-1: "#8353d1"
          energy-grid-consumption-color-2: "#ff9800"
          energy-grid-consumption-color-3: "#0f9d58"
          energy-grid-consumption-color-4: "#4db6ac"
          energy-grid-consumption-color-5: "#f06292"
          energy-grid-consumption-color-6: "#8e021b"
          energy-grid-consumption-color-7: "#00bcd4"
You then have to choose the good-bars theme in the user settings (click on your use ison at the bottom of the dashboard).
Average consumption Pie charts
These are made up of the SQL sensors. They use the apexcharts custom card from HACS.
type: custom:apexcharts-card
chart_type: donut
update_interval: 1min
series:
  - entity: sensor.cooking_all_energy_l30d
    name: Cooking
  - entity: sensor.cleaning_all_energy_l30d
    name: Cleaning
  - entity: sensor.lights_all_energy_l30d
    name: Lights
  - entity: sensor.climate_all_energy_l30d
    name: Climate
  - entity: sensor.media_players_all_energy_l30d
    name: Media
  - entity: sensor.it_network_all_energy_l30d
    name: IT
  - entity: sensor.electricity_uncategorised_energy_l30d
    name: Unk.
header:
  show: true
  show_states: false
  colorize_states: true
  title: Total Daily Energy L30d
apex_config:
  legend:
    show: true
  plotOptions:
    pie:
      donut:
        labels:
          show: true,
          total:
            showAlways: true,
            show: true
            formatter: |
              EVAL:function(w) {
                return w.globals.seriesTotals.reduce((a, b) => {return a + b}, 0).toLocaleString();
              }
I hope this is useful for someone.