Having 2 vertical stacked cards side by side

I’ve created 2 vertical-stacked cards using Canary. For reference reasons, I used the Corona-Virus integration for that.
All I want to achieve now is having them side by side, and I thought that works quiet straight forward with the custom:card-layout -but for me it does not.
So basically I just want them next to each other:

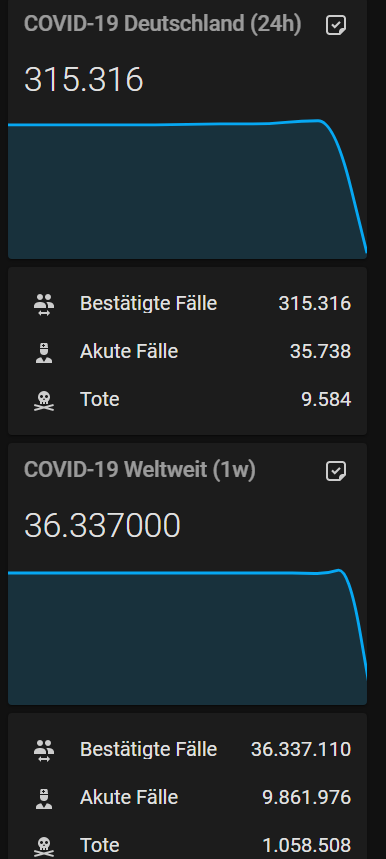
Am I missing logic, or is that simply not possible ?

My code so far:

views:
  - title: Dev
    panel: true
    cards:
      - type: custom:layout-card
        layout: horizontal
        column_width: 20%
        cards:
          - type: vertical-stack
            in_card: false
            cards:
              - type: "custom:mini-graph-card"
                animate: true
                entities:
                  - entity: sensor.germany_confirmed
                    index: 0
                font_size_header: 18
                hours_to_show: 24
                points_per_hour: 0.5
                line_width: 4
                hour24: true
                decimals: 3
                height: 200
                name: COVID-19 Deutschland (24h)
                show:
                  extrema: false
                  icon: true
              - type: entities
                show_header_toggle: false
                style: |
                  ha-card {
                    font-size: 20px;
                  }
                entities:
                  - entity: sensor.germany_confirmed
                    icon: "mdi:account-switch"
                    name: Bestätigte Fälle
                  - entity: sensor.germany_current
                    icon: "mdi:doctor"
                    name: Akute Fälle
                  - entity: sensor.germany_deaths
                    icon: "mdi:skull-crossbones"
                    name: Tote

              - type: "custom:mini-graph-card"
                animate: true
                entities:
                  - entity: sensor.worldwide_confirmed
                    index: 0
                font_size_header: 18
                hours_to_show: 168
                points_per_hour: 0.10
                line_width: 4
                hour24: true
                decimals: 6
                height: 200
                name: COVID-19 Weltweit (1w)
                show:
                  extrema: false
                  icon: true
              - type: entities
                show_header_toggle: false
                style: |
                  ha-card {
                    font-size: 20px;
                  }
                entities:
                  - entity: sensor.worldwide_confirmed
                    icon: "mdi:account-switch"
                    name: Bestätigte Fälle
                  - entity: sensor.worldwide_current
                    icon: "mdi:doctor"
                    name: Akute Fälle
                  - entity: sensor.worldwide_deaths
                    icon: "mdi:skull-crossbones"
                    name: Tote

Cheers

If you create a horizontal stack of two cards and put a vertical stack in each one, that should do it. I’ve done it the other way round (vertical stack of horizontal stack cards) a few times and it looks good - though you have to focus!

I did it via the UI, but the code looked like this:

type: vertical-stack
cards:
  - type: markdown
    content: ___
  - type: horizontal-stack
    cards:
      - type: weather-forecast
        entity: weather.openweathermap
      - type: entities
        entities:
          - entity: sensor.openweathermap_rain
          - entity: sensor.openweathermap_snow
          - entity: sensor.openweathermap_wind_speed
          - entity: sensor.openweathermap_wind_gust
        show_header_toggle: false
        state_color: true
  - type: markdown
    content: ___
  - type: horizontal-stack
    cards:
      - type: 'custom:mini-graph-card'
        name: 'Temperature now:'
        hours_to_show: 240
        entities:
          - entity: sensor.temperature
          - color: gray
            entity: input_number.night_time
            name: Night
            show_line: false
            show_points: false
            show_legend: false
            y_axis: secondary
        line_width: 2
        show:
          labels: true
          points: true
      - type: 'custom:mini-graph-card'
        name: 'Humidity now:'
        hours_to_show: 240
        entities:
          - entity: sensor.humidity
          - color: gray
            entity: input_number.night_time
            name: Night
            show_line: false
            show_points: false
            show_legend: false
            y_axis: secondary
        line_width: 2
        show:
          labels: true
          points: true

The markdown cards are dividing lines. The custom cards are just pretty graphs.

1 Like

That worked like charm, great!
Thanks for pointing that out, I knew it was quiet simple to do. :smiley:

Code looks now like this (I removed all parameters, so it is better to read):

    cards:
      - type: custom:layout-card
        column_width: 100%
        cards:
          - type: horizontal-stack
            cards:
              - type: vertical-stack
                in_card: false
                cards:
                  - type: "custom:mini-graph-card"
                    entities:
                      - entity: sensor.germany_confirmed
                  - type: entities
                    entities:
                      - entity: sensor.germany_confirmed
                      - entity: sensor.germany_current
                      - entity: sensor.germany_deaths
              - type: vertical-stack
                in_card: false
                cards:
                  - type: "custom:mini-graph-card"
                      - entity: sensor.worldwide_confirmed
                  - type: entities
                    entities:
                      - entity: sensor.worldwide_confirmed
                      - entity: sensor.worldwide_current
                      - entity: sensor.worldwide_deaths