Health and Fitness Data Into Home Assistant - HA Companion App and Health Connect

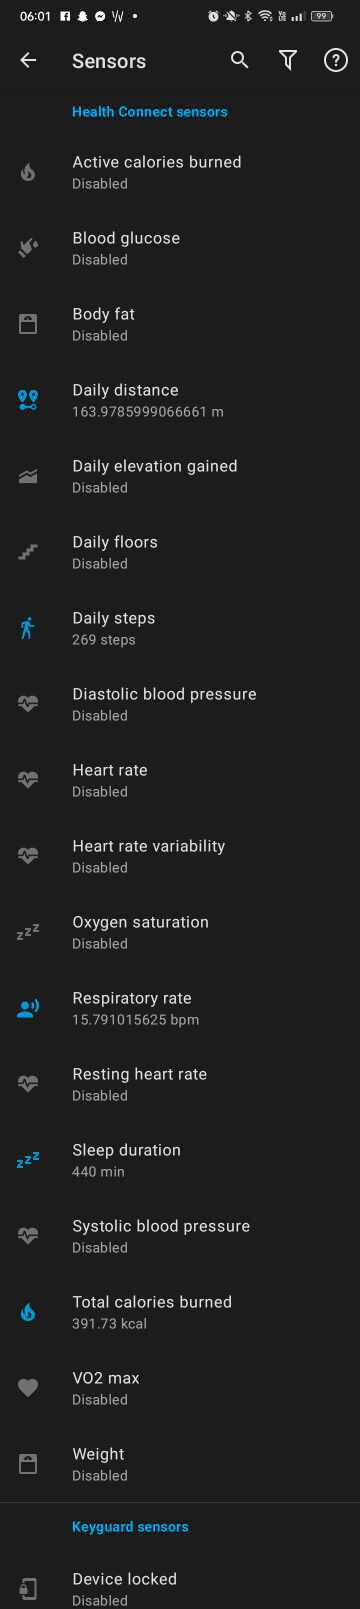
There is a lot of Health Connect sensors available for the Android Platform. These can be used to create Health/Fitness dashboard. Depending on what devices you have will dictate what sensors will be available.

There is a bit of work to get these into Home Assistant. The below examples are getting Whoop data from a Whoop 4.0 into Health Connect. Which then can be viewed in Google Fit or HA Companion App.

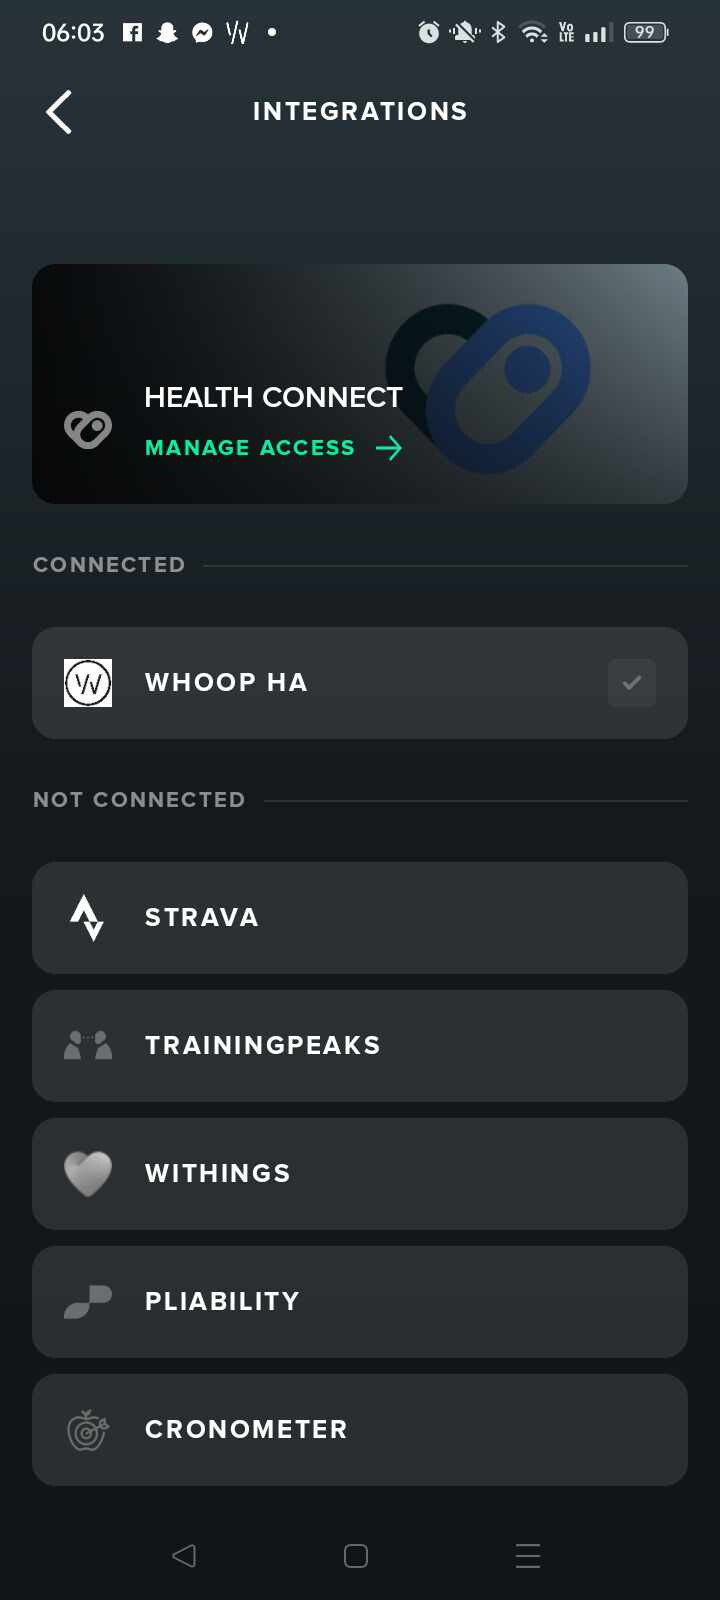
Within the Whoop App there is integrations that Whoop can connect to.

Clicking on the Health Connect integration, will give you a screen for permissions and data.

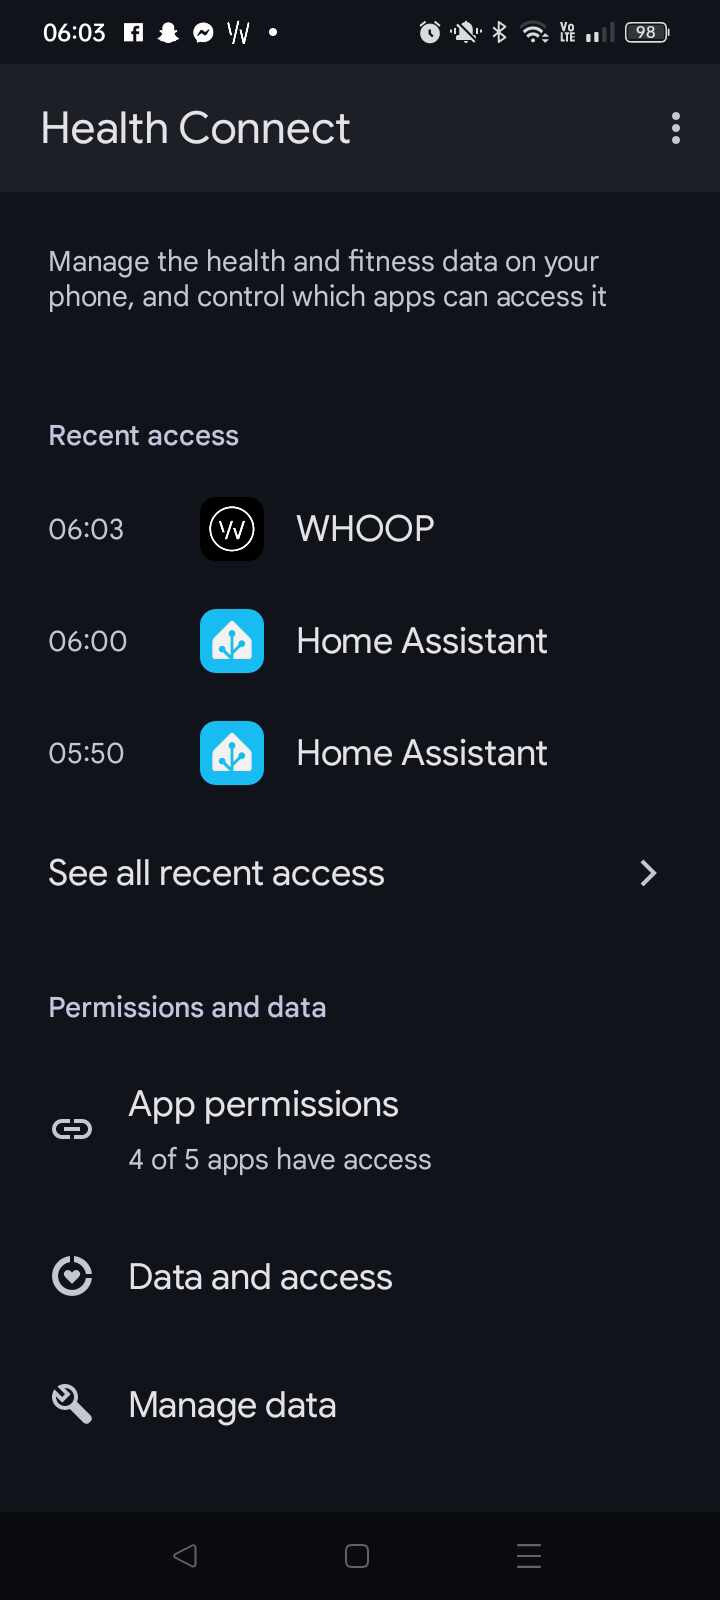
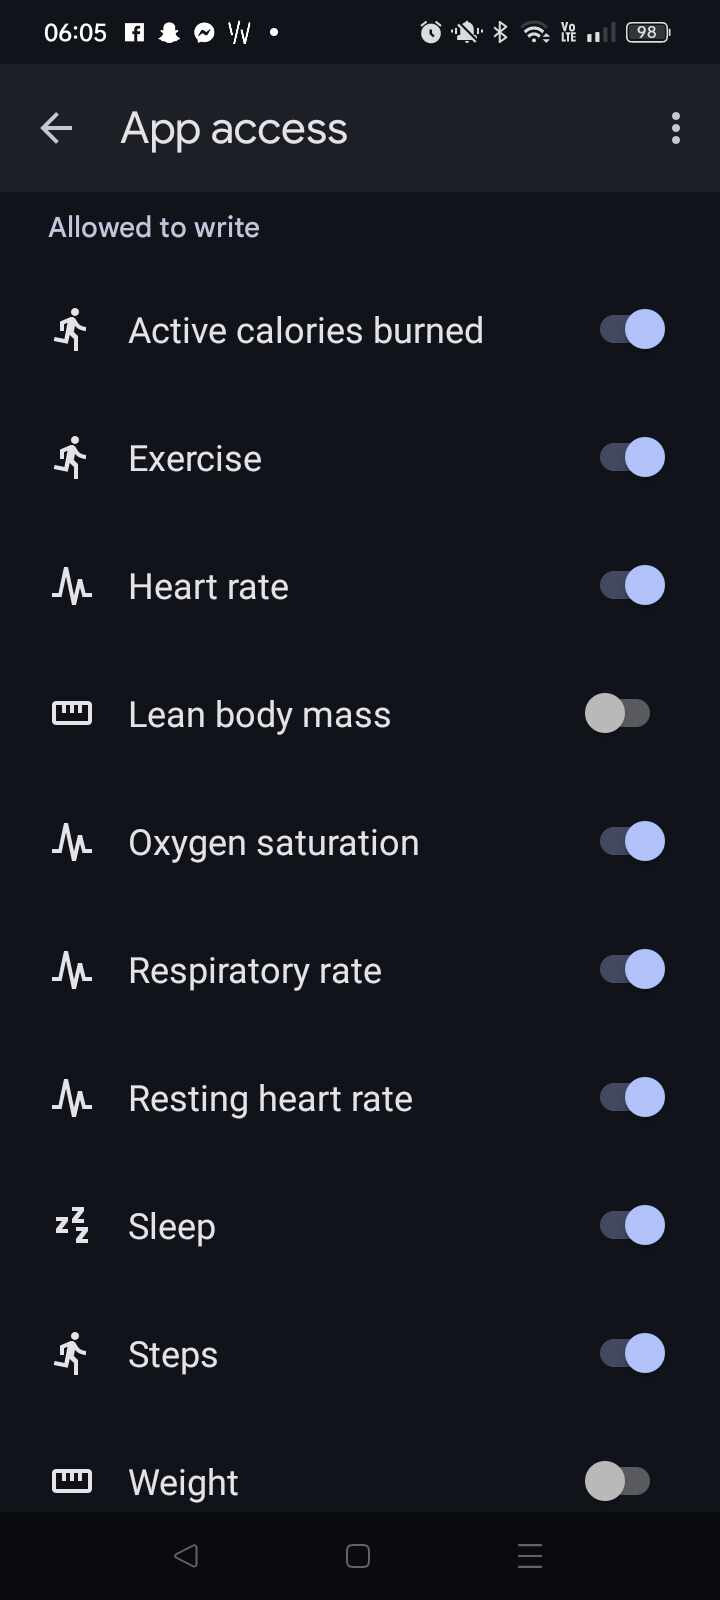
Clicking on App Permissions you will be shown what Apps are integrated with Health Connect. from here you can select a particular App and change the red/write permissions to Health Connect

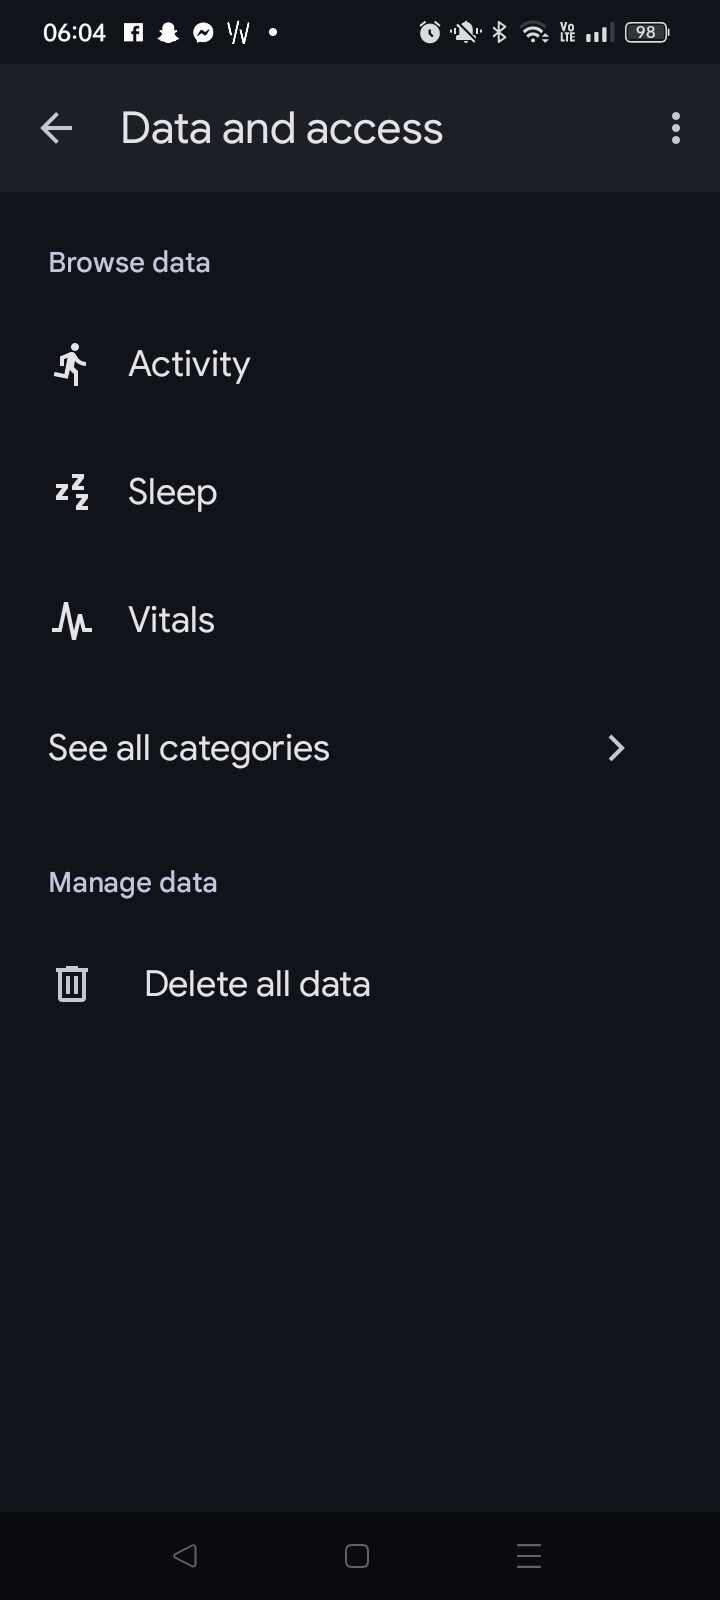
Clicking on Data and Access you can select particular sets of data select what Apps have read and write permissions to Health Connect.


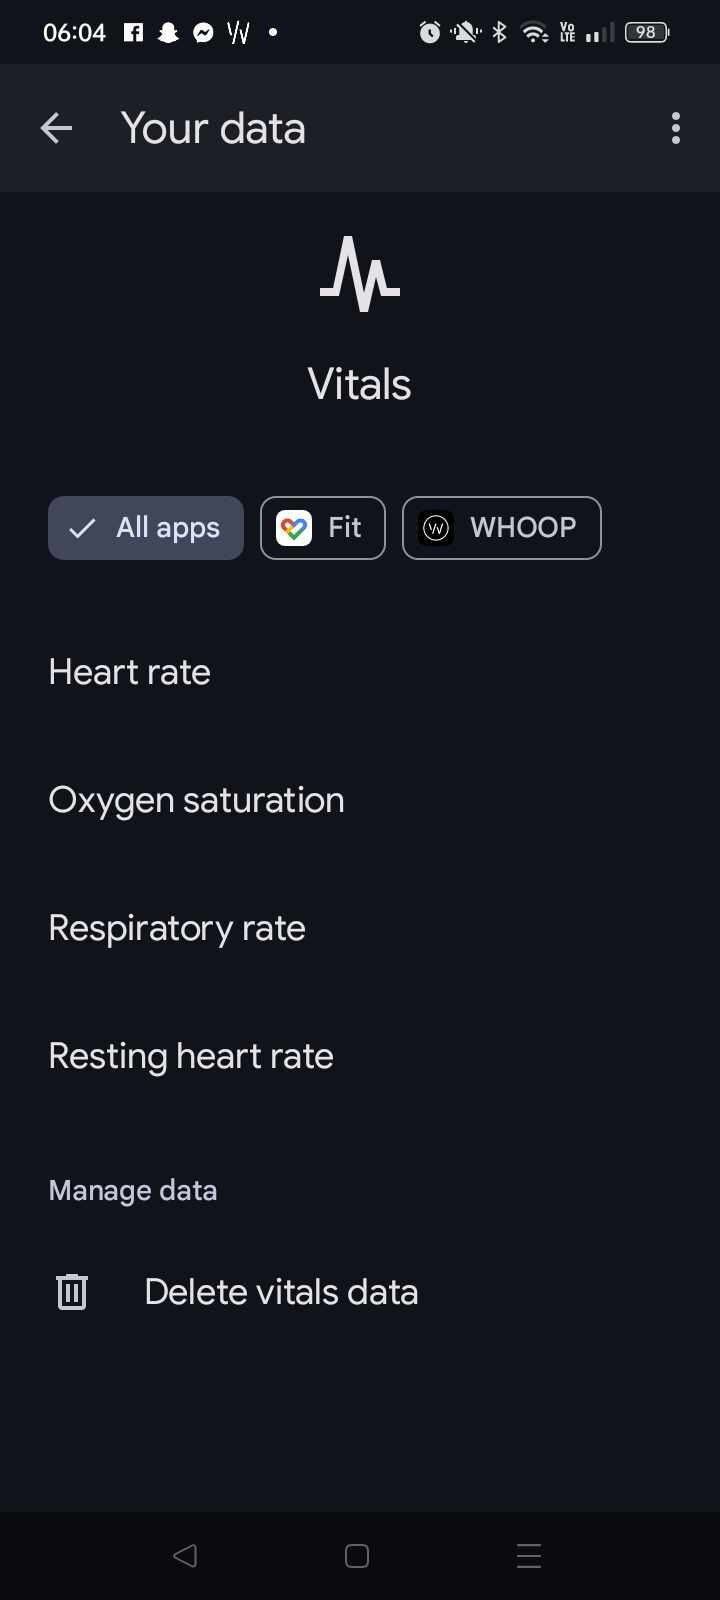
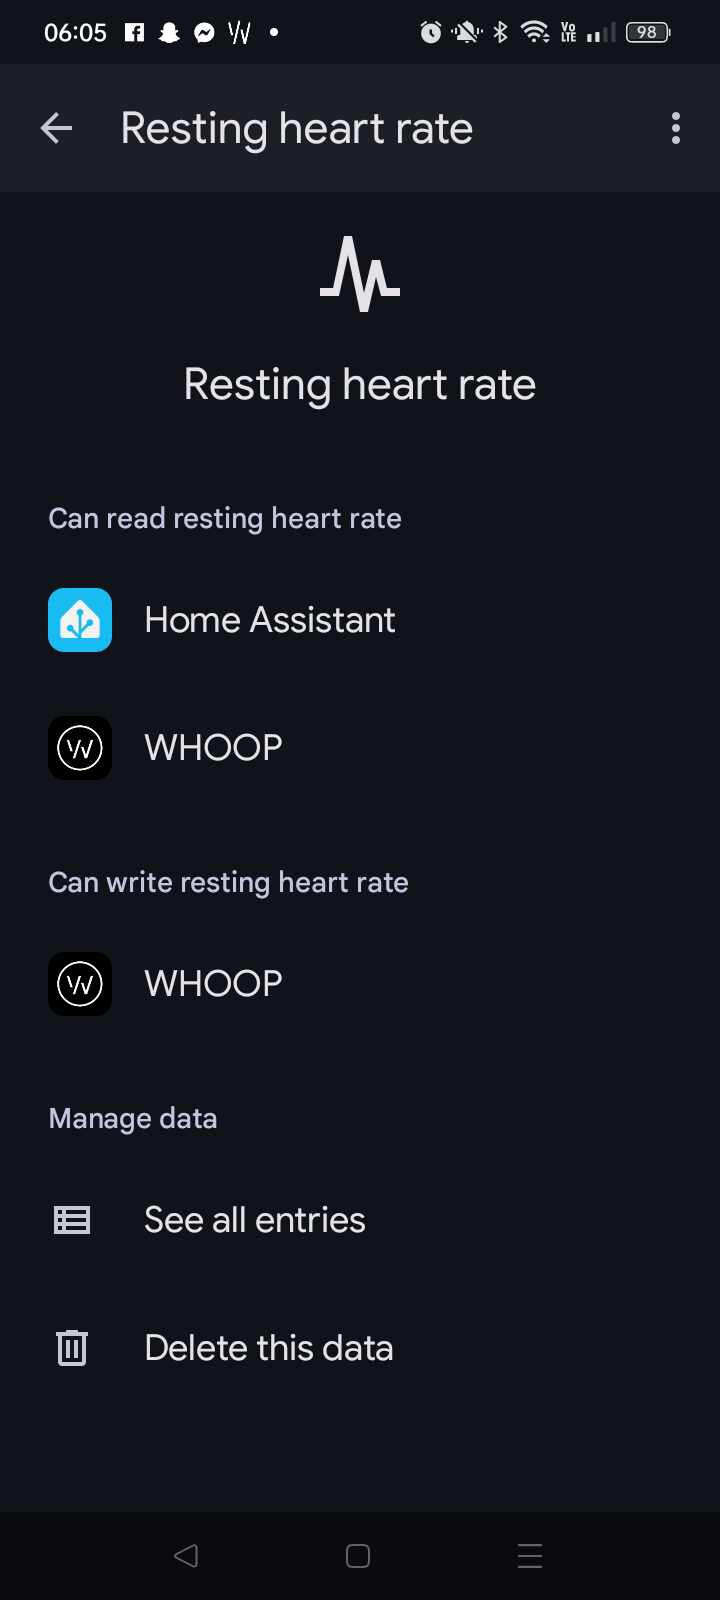
Allowed to read, Allows your App (Whoop/Garmin) to read data from Health Connect.

Allowed to write, Allows your App (Whoop/Garmin) to write data to Health Connect.

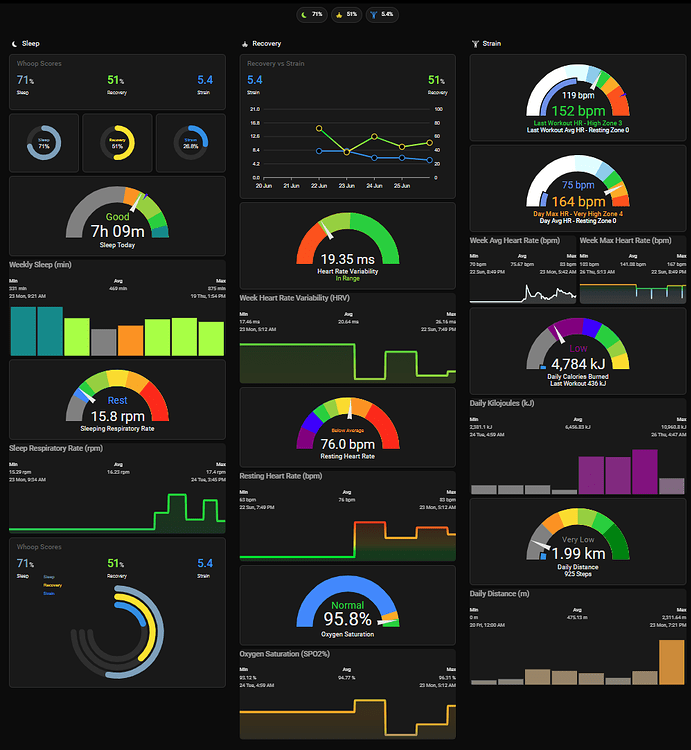
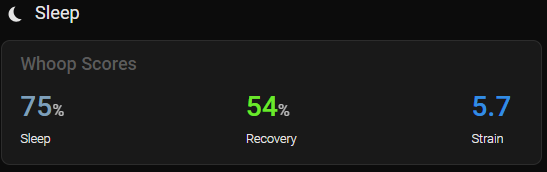
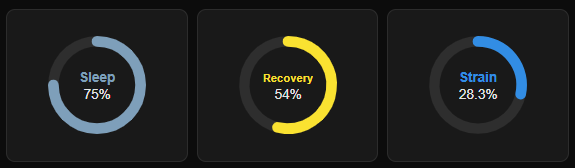
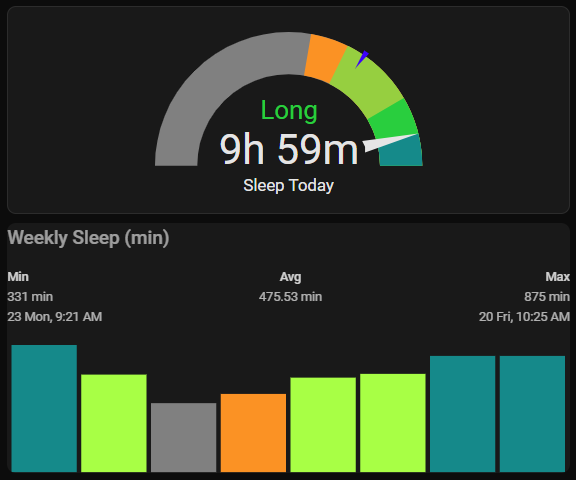
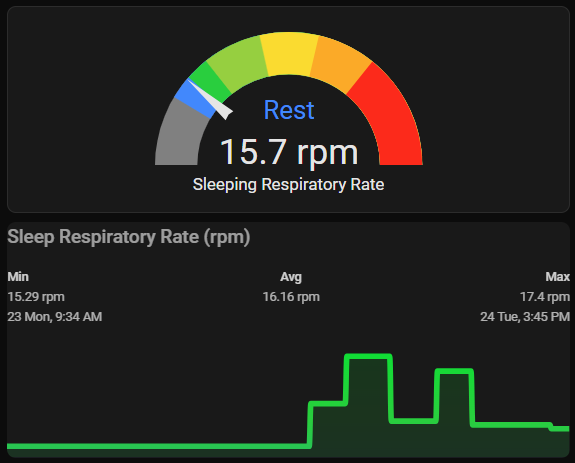
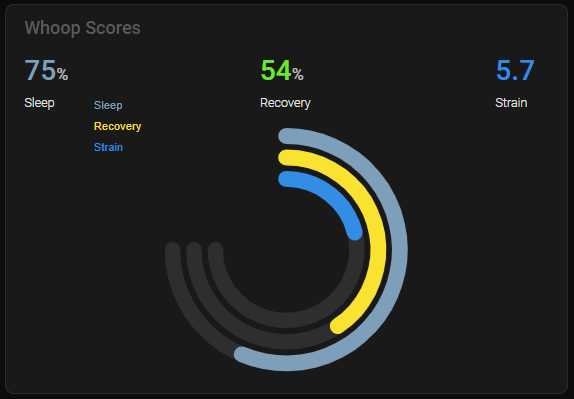
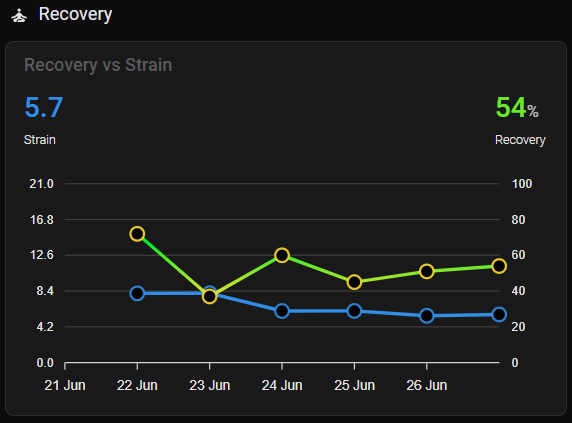
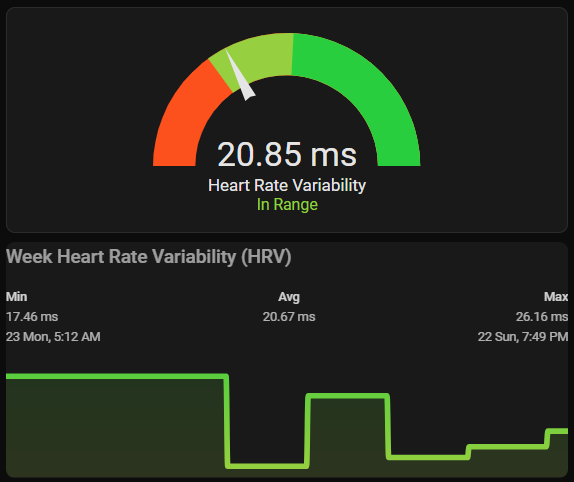
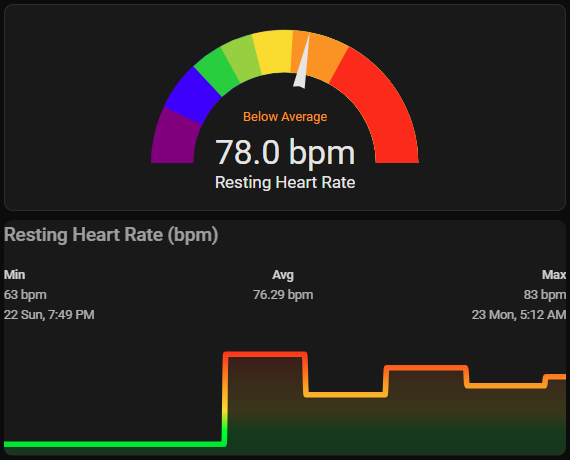
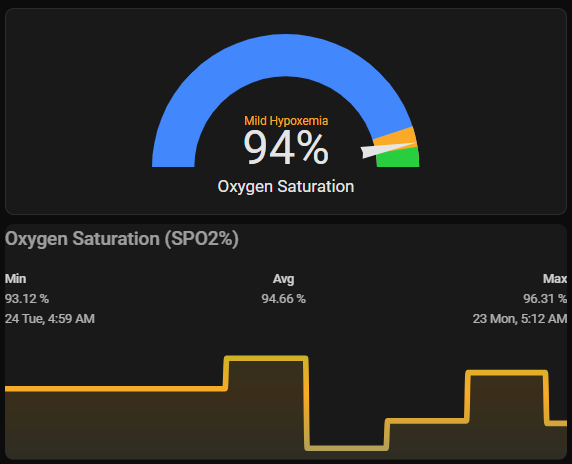
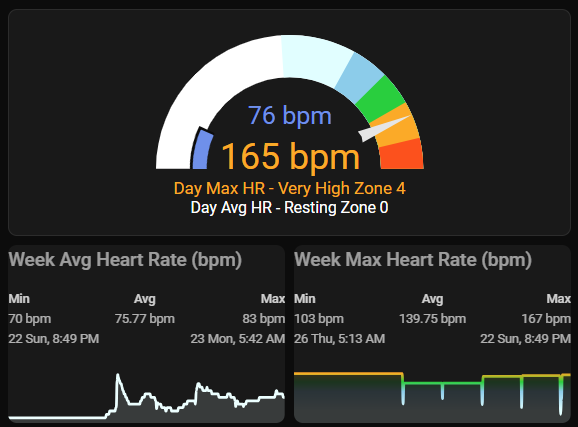
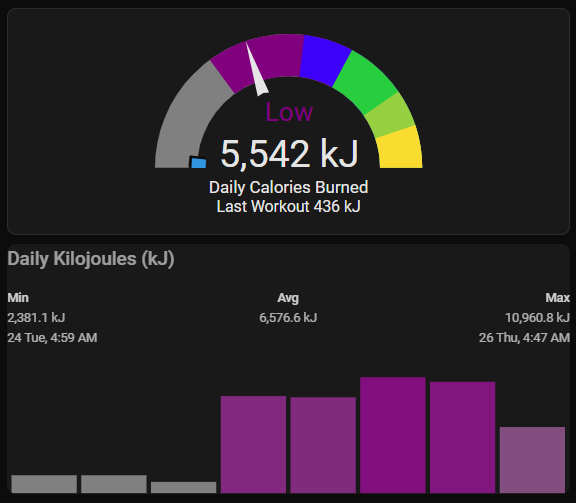
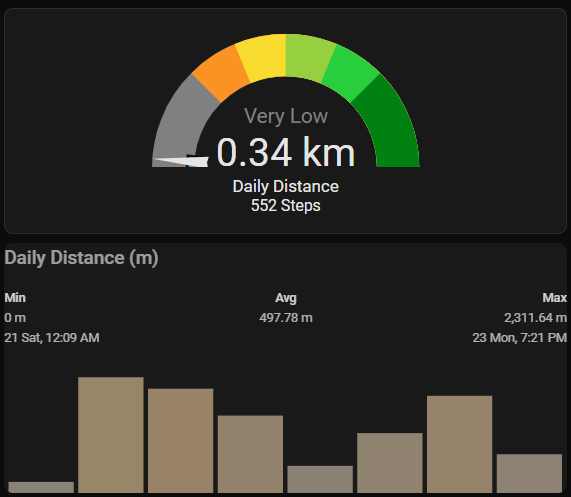
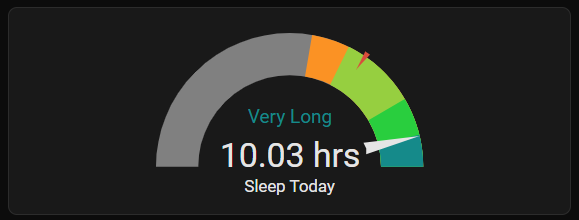
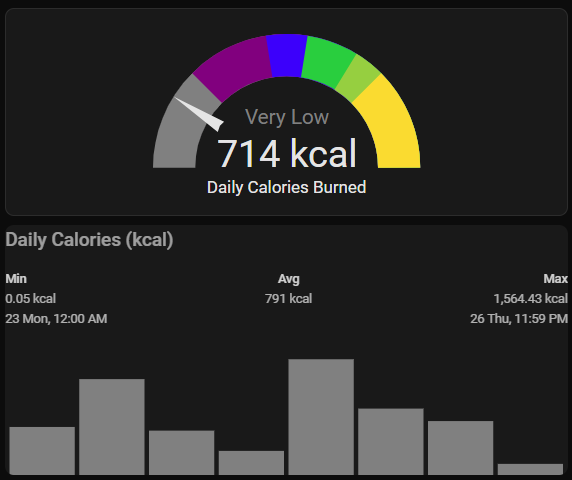
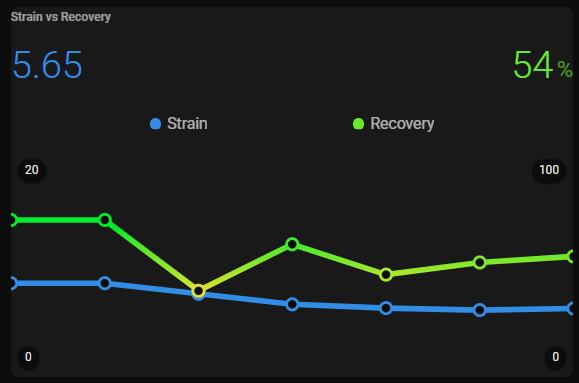
Dashboard for Health Metrics. Health Connect (Whoop/Google Fit) - HA Companion App.

Dashboard for Health Metrics. Whoop Integration
If anyone wants code for the cards, I will post in this thread. The below displays what is available through the Whoop Integration. 50 Sensors in total.

2 Likes

wow that looks awesome! can you share the code used for the tiles? I think others may find this useful :slight_smile: great work!!

1 Like
Whoop Scores (Apex Charts Card)
type: custom:apexcharts-card
header:
  show: true
  title: Whoop Scores
  floating: true
  show_states: true
  colorize_states: true
experimental:
  color_threshold: true
chart_type: radialBar
apex_config:
  chart:
    offsetX: 0
    offsetY: 0
  grid:
    padding:
      left: 0
      right: 0
      bottom: -450
      top: 20
  plotOptions:
    radialBar:
      offsetY: 60
      startAngle: 0
      endAngle: 270
      hollow:
        margin: 100
        size: 30%
        background: transparent
      dataLabels:
        name:
          show: true
        value:
          show: true
      barLabels:
        enabled: true
        useSeriesColors: true
        offsetX: 0
        offsetY: 0
        fontSize: 15
      track:
        show: true
        margin: 7
  legend:
    show: false
    floating: true
    fontSize: 10px
    position: bottom
    offsetX: -15
    offsetY: 0
    labels:
      useSeriesColors: true
    markers:
      size: 0
series:
  - entity: sensor.whoop_andrew_sleep_performance
    name: Sleep
    fill_raw: last
    color_threshold:
      - value: 0
        color: " #7BA1BB"
    show:
      legend_value: false
      header_color_threshold: true
  - entity: sensor.whoop_andrew_recovery_score
    name: Recovery
    fill_raw: last
    color_threshold:
      - value: 0
        color: "#FF0026"
      - value: 34
        color: "#FFDE00"
      - value: 67
        color: "#16EC06"
    show:
      legend_value: false
      header_color_threshold: true
  - entity: sensor.whoop_andrew_day_strain
    name: Strain
    fill_raw: last
    min: 0
    max: 20
    color_threshold:
      - value: 0
        color: "#0093E7"
    show:
      legend_value: false
      header_color_threshold: true

Whoop Scores (Horizontal Stack of Apex Chart Cards)
- type: horizontal-stack
            cards:
              - type: custom:apexcharts-card
                header:
                  show: false
                  title: Whoop Scores
                  floating: true
                  show_states: false
                  colorize_states: true
                experimental:
                  color_threshold: true
                chart_type: radialBar
                apex_config:
                  chart:
                    offsetX: 0
                    offsetY: 0
                  grid:
                    padding:
                      left: 0
                      right: 0
                      bottom: 0
                      top: 0
                  plotOptions:
                    radialBar:
                      offsetY: 0
                      startAngle: 0
                      endAngle: 360
                      hollow:
                        margin: 100
                        size: 50%
                        background: transparent
                      dataLabels:
                        name:
                          show: true
                          fontSize: 12
                          offsetY: -3
                        value:
                          show: true
                          fontSize: 12
                          offsetY: -4
                  legend:
                    show: false
                    floating: true
                    fontSize: 10px
                    position: bottom
                    offsetX: -15
                    offsetY: 0
                    labels:
                      useSeriesColors: true
                    markers:
                      size: 0
                series:
                  - entity: sensor.whoop_andrew_sleep_performance
                    name: Sleep
                    fill_raw: last
                    color_threshold:
                      - value: 0
                        color: ' #7BA1BB'
                    show:
                      legend_value: false
                      header_color_threshold: true
              - type: custom:apexcharts-card
                header:
                  show: false
                  title: Whoop Scores
                  floating: true
                  show_states: false
                  colorize_states: true
                experimental:
                  color_threshold: true
                chart_type: radialBar
                apex_config:
                  chart:
                    offsetX: 0
                    offsetY: 0
                  grid:
                    padding:
                      left: 0
                      right: 0
                      bottom: 0
                      top: 0
                  plotOptions:
                    radialBar:
                      offsetY: 0
                      startAngle: 0
                      endAngle: 360
                      hollow:
                        margin: 100
                        size: 50%
                        background: transparent
                      dataLabels:
                        name:
                          show: true
                          fontSize: 10
                          offsetY: -3
                        value:
                          show: true
                          fontSize: 12
                          offsetY: -4
                  legend:
                    show: false
                    floating: true
                    fontSize: 10px
                    position: bottom
                    offsetX: -15
                    offsetY: 0
                    labels:
                      useSeriesColors: true
                    markers:
                      size: 0
                series:
                  - entity: sensor.whoop_andrew_recovery_score
                    name: Recovery
                    fill_raw: last
                    color_threshold:
                      - value: 0
                        color: '#FF0026'
                      - value: 34
                        color: '#FFDE00'
                      - value: 67
                        color: '#16EC06'
                    show:
                      legend_value: false
                      header_color_threshold: true
              - type: custom:apexcharts-card
                header:
                  show: false
                  title: Whoop Scores
                  floating: true
                  show_states: false
                  colorize_states: true
                experimental:
                  color_threshold: true
                chart_type: radialBar
                apex_config:
                  chart:
                    offsetX: 0
                    offsetY: 0
                  grid:
                    padding:
                      left: 0
                      right: 0
                      bottom: 0
                      top: 0
                  plotOptions:
                    radialBar:
                      offsetY: 0
                      startAngle: 0
                      endAngle: 360
                      hollow:
                        margin: 100
                        size: 50%
                        background: transparent
                      dataLabels:
                        name:
                          show: true
                          fontSize: 12
                          offsetY: -3
                        value:
                          show: true
                          fontSize: 12
                          offsetY: -4
                  legend:
                    show: false
                    floating: true
                    fontSize: 10px
                    position: bottom
                    offsetX: -15
                    offsetY: 0
                    labels:
                      useSeriesColors: true
                    markers:
                      size: 0
                series:
                  - entity: sensor.whoop_andrew_day_strain
                    name: Strain
                    fill_raw: last
                    min: 0
                    max: 20
                    color_threshold:
                      - value: 0
                        color: '#0093E7'
                    show:
                      legend_value: false
                      header_color_threshold: true

Whoop Time in Bed (Gauge Card Pro and Mini Graph Card)
- type: custom:gauge-card-pro
            entity: sensor.whoop_andrew_sleep_time_in_bed
            min: 0
            max: 39000
            needle: true
            gradient: false
            segments:
              - from: 0
                color: gray
              - from: 21600
                color: darkorange
              - from: 25200
                color: yellowgreen
              - from: 32400
                color: limegreen
              - from: 36000
                color: darkcyan
            titles:
              primary: Sleep Today
            value_texts:
              primary: "{% set secs = states('sensor.whoop_andrew_sleep_time_in_bed') | float %} {% set h = (secs / 3600) | int %} {% set m = ((secs % 3600) / 60) | int %} {{ h }}h\_{{ '%02d'\_%\_m }}m\n"
              primary_unit: hrs
              secondary: >-
                {% set mins = states('sensor.whoop_andrew_sleep_time_in_bed') |
                float(default=0) %} {% if mins < 21600 %}
                  Very Short
                {% elif mins < 25200 %}
                  Short
                {% elif mins < 32400 %}
                  Good
                {% elif mins < 36000 %}
                  Long
                {% else %}
                  Very Long
                {% endif %}
              secondary_color: >-
                {% set mins = states('sensor.whoop_andrew_sleep_time_in_bed') |
                float(default=0) %} {% if mins < 21600 %}
                  gray
                {% elif mins < 25200 %}
                  darkorange
                {% elif mins < 32400 %}
                  yellowgreen
                {% elif mins < 36000 %}
                  limegreen
                {% else %}
                  darkcyan
                {% endif %}
            grid_options:
              columns: 12
              rows: auto
            setpoint:
              value: 26967.259
              color: blue
          - type: custom:mini-graph-card
            entities:
              - entity: sensor.cph2271_sleep_duration
                name: Weekly Sleep (min)
                unit: min
            show:
              graph: bar
              name: true
              extrema: true
              average: true
              state: false
              icon: false
            color_thresholds:
              - value: 0
                color: '#808080'
              - value: 360
                color: '#FF8C00'
              - value: 420
                color: '#ADFF2F'
              - value: 540
                color: '#32CD32'
              - value: 600
                color: '#008B8B'
            color_thresholds_transition: hard
            font_size: 80
            height: 113
            hours_to_show: 168
            points_per_hour: 0.0417
            group: true
            lower_bound: 0
            upper_bound: 600
            smoothing: false- type: custom:gauge-card-pro
            entity: sensor.whoop_andrew_sleep_time_in_bed
            min: 0
            max: 39000
            needle: true
            gradient: false
            segments:
              - from: 0
                color: gray
              - from: 21600
                color: darkorange
              - from: 25200
                color: yellowgreen
              - from: 32400
                color: limegreen
              - from: 36000
                color: darkcyan
            titles:
              primary: Sleep Today
            value_texts:
              primary: "{% set secs = states('sensor.whoop_andrew_sleep_time_in_bed') | float %} {% set h = (secs / 3600) | int %} {% set m = ((secs % 3600) / 60) | int %} {{ h }}h\_{{ '%02d'\_%\_m }}m\n"
              primary_unit: hrs
              secondary: >-
                {% set mins = states('sensor.whoop_andrew_sleep_time_in_bed') |
                float(default=0) %} {% if mins < 21600 %}
                  Very Short
                {% elif mins < 25200 %}
                  Short
                {% elif mins < 32400 %}
                  Good
                {% elif mins < 36000 %}
                  Long
                {% else %}
                  Very Long
                {% endif %}
              secondary_color: >-
                {% set mins = states('sensor.whoop_andrew_sleep_time_in_bed') |
                float(default=0) %} {% if mins < 21600 %}
                  gray
                {% elif mins < 25200 %}
                  darkorange
                {% elif mins < 32400 %}
                  yellowgreen
                {% elif mins < 36000 %}
                  limegreen
                {% else %}
                  darkcyan
                {% endif %}
            grid_options:
              columns: 12
              rows: auto
            setpoint:
              value: 26967.259
              color: blue
          - type: custom:mini-graph-card
            entities:
              - entity: sensor.cph2271_sleep_duration
                name: Weekly Sleep (min)
                unit: min
            show:
              graph: bar
              name: true
              extrema: true
              average: true
              state: false
              icon: false
            color_thresholds:
              - value: 0
                color: '#808080'
              - value: 360
                color: '#FF8C00'
              - value: 420
                color: '#ADFF2F'
              - value: 540
                color: '#32CD32'
              - value: 600
                color: '#008B8B'
            color_thresholds_transition: hard
            font_size: 80
            height: 113
            hours_to_show: 168
            points_per_hour: 0.0417
            group: true
            lower_bound: 0
            upper_bound: 600
            smoothing: false

Whoop Sleep Respiratory Rate (Gauge Card Pro and Mini Graph Card)
- type: custom:gauge-card-pro
            entity: sensor.whoop_andrew_sleep_respiratory_rate
            min: 0
            max: 70
            needle: true
            gradient: false
            segments:
              - from: 0
                to: 11.9
                color: gray
              - from: 12
                to: 16
                color: dodgerblue
              - from: 16.1
                to: 20
                color: limegreen
              - from: 20.1
                to: 30
                color: yellowgreen
              - from: 30.1
                to: 40
                color: gold
              - from: 40.1
                to: 50
                color: orange
              - from: 50.1
                to: 70
                color: red
            titles:
              primary: Sleeping Respiratory Rate
            value_texts:
              primary: >-
                {{ ( states('sensor.cph2271_respiratory_rate') | float ) |
                round(1) }}
              primary_unit: rpm
              secondary: >-
                {% set rpm = states('sensor.cph2271_respiratory_rate') |
                float(default=0) %} {% if rpm < 12 %}
                  Low (Bradypnea)
                {% elif rpm <= 16 %}
                  Rest
                {% elif rpm <= 20 %}
                  Light
                {% elif rpm <= 30 %}
                  Moderate
                {% elif rpm <= 40 %}
                  High
                {% elif rpm <= 50 %}
                  Very High
                {% else %}
                  Maximum
                {% endif %}
              secondary_color: >-
                {% set rpm = states('sensor.cph2271_respiratory_rate') |
                float(default=0) %} {% if rpm < 12 %}
                  gray
                {% elif rpm <= 16 %}
                  dodgerblue
                {% elif rpm <= 20 %}
                  limegreen
                {% elif rpm <= 30 %}
                  lime
                {% elif rpm <= 40 %}
                  gold
                {% elif rpm <= 50 %}
                  orange
                {% else %}
                  red
                {% endif %}

Whoop Scores (Apex Charts Card)
- type: custom:apexcharts-card
            header:
              show: true
              title: Whoop Scores
              floating: true
              show_states: true
              colorize_states: true
            experimental:
              color_threshold: true
            chart_type: radialBar
            apex_config:
              chart:
                offsetX: 0
                offsetY: 10
              grid:
                padding:
                  left: 0
                  right: 0
                  bottom: 0
                  top: 70
              plotOptions:
                radialBar:
                  offsetY: 0
                  startAngle: 0
                  endAngle: 270
                  hollow:
                    margin: 100
                    size: 40%
                    background: transparent
                  dataLabels:
                    name:
                      show: true
                    value:
                      show: true
              legend:
                show: true
                floating: true
                fontSize: 10px
                position: left
                offsetX: 40
                offsetY: 50
                labels:
                  useSeriesColors: true
                markers:
                  size: 0
            series:
              - entity: sensor.whoop_andrew_sleep_performance
                name: Sleep
                fill_raw: last
                color_threshold:
                  - value: 0
                    color: ' #7BA1BB'
                show:
                  legend_value: false
                  header_color_threshold: true
              - entity: sensor.whoop_andrew_recovery_score
                name: Recovery
                fill_raw: last
                color_threshold:
                  - value: 0
                    color: '#FF0026'
                  - value: 34
                    color: '#FFDE00'
                  - value: 67
                    color: '#16EC06'
                show:
                  legend_value: false
                  header_color_threshold: true
              - entity: sensor.whoop_andrew_day_strain
                name: Strain
                fill_raw: last
                min: 0
                max: 20
                color_threshold:
                  - value: 0
                    color: '#0093E7'
                show:
                  legend_value: false
                  header_color_threshold: true

Whoop Recovery vs Strain (Apex Charts Card)
- type: heading
            heading: Recovery
            heading_style: title
            icon: mdi:meditation
          - type: custom:apexcharts-card
            graph_span: 7d
            span:
              end: day
            experimental:
              color_threshold: true
            header:
              show: true
              title: Recovery vs Strain
              show_states: true
              colorize_states: true
            apex_config:
              chart:
                height: 220
              grid:
                show: true
                borderColor: '#404040'
                strokeDashArray: 0
                yaxis:
                  lines:
                    show: true
              legend:
                show: false
                labels:
                  useSeriesColors: true
              markers:
                size: 6
                shape: circle
                hover:
                  size: 8
                discrete:
                  - seriesIndex: 1
                    dataPointIndex: 0
                    fillColor: '#000000'
                    strokeColor: '#FFD700'
                    size: 6
                    shape: circle
                  - seriesIndex: 1
                    dataPointIndex: 1
                    fillColor: '#000000'
                    strokeColor: '#FFD700'
                    size: 6
                    shape: circle
                  - seriesIndex: 1
                    dataPointIndex: 2
                    fillColor: '#000000'
                    strokeColor: '#FFD700'
                    size: 6
                    shape: circle
                  - seriesIndex: 1
                    dataPointIndex: 3
                    fillColor: '#000000'
                    strokeColor: '#FFD700'
                    size: 6
                    shape: circle
                  - seriesIndex: 1
                    dataPointIndex: 4
                    fillColor: '#000000'
                    strokeColor: '#FFD700'
                    size: 6
                    shape: circle
                  - seriesIndex: 1
                    dataPointIndex: 5
                    fillColor: '#000000'
                    strokeColor: '#FFD700'
                    size: 6
                    shape: circle
                  - seriesIndex: 1
                    dataPointIndex: 6
                    fillColor: '#000000'
                    strokeColor: '#FFD700'
                    size: 6
                    shape: circle
                  - seriesIndex: 0
                    dataPointIndex: 0
                    fillColor: '#000000'
                    strokeColor: '#0093E7'
                    size: 6
                    shape: circle
                  - seriesIndex: 0
                    dataPointIndex: 1
                    fillColor: '#000000'
                    strokeColor: '#0093E7'
                    size: 6
                    shape: circle
                  - seriesIndex: 0
                    dataPointIndex: 2
                    fillColor: '#000000'
                    strokeColor: '#0093E7'
                    size: 6
                    shape: circle
                  - seriesIndex: 0
                    dataPointIndex: 3
                    fillColor: '#000000'
                    strokeColor: '#0093E7'
                    size: 6
                    shape: circle
                  - seriesIndex: 0
                    dataPointIndex: 4
                    fillColor: '#000000'
                    strokeColor: '#0093E7'
                    size: 6
                    shape: circle
                  - seriesIndex: 0
                    dataPointIndex: 5
                    fillColor: '#000000'
                    strokeColor: '#0093E7'
                    size: 6
                    shape: circle
                  - seriesIndex: 0
                    dataPointIndex: 6
                    fillColor: '#000000'
                    strokeColor: '#0093E7'
                    size: 6
                    shape: circle
            yaxis:
              - id: strain
                min: 0
                max: 21
                decimals: 1
                opposite: false
              - id: recovery
                min: 0
                max: 100
                decimals: 0
                opposite: true
            series:
              - entity: sensor.whoop_andrew_day_strain
                name: Strain
                yaxis_id: strain
                type: line
                curve: straight
                stroke_width: 3
                color: '#0093E7'
                fill_raw: last
                show:
                  in_header: raw
                group_by:
                  func: max
                  duration: 1d
              - entity: sensor.whoop_andrew_recovery_score
                name: Recovery
                yaxis_id: recovery
                type: line
                curve: straight
                stroke_width: 3
                fill_raw: last
                show:
                  in_header: raw
                  legend_value: true
                  header_color_threshold: true
                group_by:
                  func: max
                  duration: 1d
                color_threshold:
                  - value: 0
                    color: '#FF0026'
                  - value: 34
                    color: '#FFDE00'
                  - value: 67
                    color: '#16EC06'

Whoop Heart Rate Variance (Gauge Card Pro and Mini Graph Card)
- type: custom:gauge-card-pro
            entity: sensor.whoop_andrew_hrv
            needle: true
            gradient: false
            min: 0
            max: 60
            segments:
              - from: 0
                color: orangered
              - from: 18
                color: yellowgreen
              - from: 31
                color: limegreen
            titles:
              primary: Heart Rate Variability
              secondary: >
                {% set hrv = states('sensor.whoop_andrew_hrv') |
                float(default=0) %}

                {% if hrv < 18 %}
                  Low
                {% elif hrv < 31 %}
                  In Range
                {% else %}
                  High
                {% endif %}
              secondary_color: >
                {% set hrv = states('sensor.whoop_andrew_hrv') |
                float(default=0) %}

                {% if hrv < 18 %}
                  orangered
                {% elif hrv < 31 %}
                  yellowgreen
                {% else %}
                  limegreen
                {% endif %}
            grid_options:
              columns: 12
              rows: auto
          - type: custom:mini-graph-card
            entities:
              - sensor.whoop_andrew_hrv
            name: Week Heart Rate Variability (HRV)
            show:
              labels_secondary: hover
              state: false
              name: true
              icon: false
              extrema: true
              average: true
            limits:
              min: 0
              max: 60
            color_thresholds:
              - value: 0
                color: orangered
              - value: 18
                color: yellowgreen
              - value: 31
                color: limegreen
            font_size: 80
            height: 100
            hours_to_show: 168
            points_per_hour: 4
            group: true

Whoop Resting Heart Rate (Gauge Card Pro and Mini Graph Card)
- type: custom:gauge-card-pro
            entity: sensor.whoop_andrew_resting_heart_rate
            segments:
              - from: 50
                color: purple
              - from: 57
                color: blue
              - from: 63
                color: limegreen
              - from: 67
                color: yellowgreen
              - from: 71
                color: gold
              - from: 76
                color: darkorange
              - from: 83
                color: red
            needle: true
            gradient: false
            titles:
              primary: Resting Heart Rate
            min: 50
            max:
              '[object Object]': null
            value_texts:
              secondary: >-
                {% set bpm = states('sensor.whoop_andrew_resting_heart_rate') |
                float(default=0) %} {% if bpm >= 50 and bpm <= 56 %}
                  Athlete
                {% elif bpm >= 57 and bpm <= 62 %}
                  Excellent
                {% elif bpm >= 63 and bpm <= 66 %}
                  Great
                {% elif bpm >= 67 and bpm <= 70 %}
                  Good
                {% elif bpm >= 71 and bpm <= 75 %}
                  Average
                {% elif bpm >= 76 and bpm <= 82 %}
                  Below Average
                {% elif bpm >= 83 %}
                  Poor
                {% else %}
                  Unknown
                {% endif %}
              secondary_color: >-
                {% set bpm = states('sensor.whoop_andrew_resting_heart_rate') |
                float(default=0) %} {% if bpm >= 50 and bpm <= 56 %}
                  purple
                {% elif bpm >= 57 and bpm <= 62 %}
                  blue
                {% elif bpm >= 63 and bpm <= 66 %}
                  limegreen
                {% elif bpm >= 67 and bpm <= 70 %}
                  lime
                {% elif bpm >= 71 and bpm <= 75 %}
                  gold
                {% elif bpm >= 76 and bpm <= 82 %}
                  darkorange
                {% elif bpm >= 83 %}
                  red
                {% else %}
                  black
                {% endif %}
            grid_options:
              columns: 12
              rows: auto
          - type: custom:mini-graph-card
            entities:
              - sensor.whoop_andrew_resting_heart_rate
            name: Resting Heart Rate (bpm)
            show:
              labels_secondary: hover
              state: false
              name: true
              icon: false
              extrema: true
              average: true
            limits:
              min: -500
              max: 500
            color_thresholds:
              - value: 50
                color: purple
              - value: 57
                color: blue
              - value: 63
                color: limegreen
              - value: 67
                color: lime
              - value: 71
                color: gold
              - value: 76
                color: darkorange
              - value: 83
                color: red
            font_size: 80
            height: 100
            hours_to_show: 168
            points_per_hour: 4
            group: true

Whoop Oxygen Saturation (Gauge Card Pro and Mini Graph Card
- type: custom:gauge-card-pro
            entity: sensor.whoop_andrew_spo2
            min: 0
            max: 100
            needle: true
            gradient: false
            segments:
              - from: 0
                to: 89.9
                color: dodgerblue
              - from: 90
                to: 94.9
                color: orange
              - from: 95
                to: 100
                color: limegreen
            titles:
              primary: Oxygen Saturation
            value_texts:
              primary: '{{ (states(''sensor.whoop_andrew_spo2'') | float) | round(1) }}'
              primary_unit: '%'
              secondary: >-
                {% set spo2 = states('sensor.whoop_andrew_spo2') |
                float(default=0) %} {% if spo2 < 90 %}
                  Severe Hypoxemia
                {% elif spo2 < 95 %}
                  Mild Hypoxemia
                {% elif spo2 <= 100 %}
                  Normal
                {% else %}
                  N/A
                {% endif %}
              secondary_color: >-
                {% set spo2 = states('sensor.whoop_andrew_spo2') |
                float(default=0) %} {% if spo2 < 90 %}
                  dodgerblue
                {% elif spo2 < 95 %}
                  orange
                {% elif spo2 <= 100 %}
                  limegreen
                {% else %}
                  black
                {% endif %}
          - type: custom:mini-graph-card
            entities:
              - sensor.whoop_andrew_spo2
            name: Oxygen Saturation (SPO2%)
            show:
              labels_secondary: hover
              state: false
              name: true
              icon: false
              extrema: true
              average: true
            limits:
              min: 80
              max: 100
            color_thresholds:
              - value: 90
                color: dodgerblue
              - value: 95
                color: orange
              - value: 100
                color: limegreen
            font_size: 80
            height: 100
            hours_to_show: 168
            points_per_hour: 4
            group: true

Whoop Last Workout Heart Rate (Gauge Card Pro and Mini Graph Card)
- type: heading
            heading_style: title
            heading: Strain
            icon: mdi:weight-lifter
          - type: custom:gauge-card-pro
            entity: sensor.whoop_andrew_last_workout_max_hr
            needle: true
            gradient: false
            min: 60
            max: 200
            segments:
              - from: 0
                color: white
              - from: 118
                color: lightcyan
              - from: 140
                color: skyblue
              - from: 151
                color: limegreen
              - from: 161
                color: orange
              - from: 172
                color: orangered
            titles:
              primary: >
                {% set bpm = states('sensor.whoop_andrew_last_workout_max_hr') |
                float(default=0) %} {% if bpm < 118 %}
                  Last Workout Max HR - Resting Zone 0
                {% elif bpm < 140 %}
                  Last Workout Max HR - Light  Zone 1
                {% elif bpm < 151 %}
                  Last Workout HR - Moderate  Zone 2
                {% elif bpm < 161 %}
                  Last Workout HR - High Zone 3
                {% elif bpm < 172 %}
                  Last Workout HR - Very High Zone 4
                {% else %}
                  Last Workout HR - Peak Zone 5
                {% endif %}
              secondary: >
                {% set bpm =
                states('sensor.whoop_andrew_last_workout_average_hre') |
                float(default=0) %} {% if bpm < 118 %}
                  Last Workout Avg HR - Resting Zone 0
                {% elif bpm < 140 %}
                  Last Workout Avg HR - Light  Zone 1
                {% elif bpm < 151 %}
                  Last Workout Avg HR - Moderate  Zone 2
                {% elif bpm < 161 %}
                  Last Workout Avg HR - High Zone 3
                {% elif bpm < 172 %}
                  Last Workout Avg HR - Very High Zone 4
                {% else %}
                  Last Workout Avg HR - Peak Zone 5
                {% endif %}
              primary_color: >
                {% set bpm = states('sensor.whoop_andrew_last_workout_max_hr') |
                float(default=0) %} {% if bpm < 118 %}
                  white
                {% elif bpm < 140 %}
                  lightcyan
                {% elif bpm < 151 %}
                  skyblue
                {% elif bpm < 161 %}
                  limegreen
                {% elif bpm < 172 %}
                  orange
                {% else %}
                  orangered
                {% endif %}
              secondary_color: >
                {% set bpm =
                states('sensor.whoop_andrew_last_workout_average_hr') |
                float(default=0) %} {% if bpm < 118 %}
                  white
                {% elif bpm < 140 %}
                  lightcyan
                {% elif bpm < 151 %}
                  skyblue
                {% elif bpm < 161 %}
                  limegreen
                {% elif bpm < 172 %}
                  orange
                {% else %}
                  orangered
                {% endif %}
            value_texts:
              primary_color: >
                {% set bpm = states('sensor.whoop_andrew_last_workout_max_hr') |
                float(default=0) %} {% if bpm < 118 %}
                  white
                {% elif bpm < 140 %}
                  lightcyan
                {% elif bpm < 151 %}
                  skyblue
                {% elif bpm < 161 %}
                  limegreen
                {% elif bpm < 172 %}
                  orange
                {% else %}
                  orangered
                {% endif %}
              secondary_color: >
                {% set bpm =
                states('sensor.whoop_andrew_last_workout_average_hr') |
                float(default=0) %} {% if bpm < 118 %}
                  white
                {% elif bpm < 140 %}
                  lightcyan
                {% elif bpm < 151 %}
                  skyblue
                {% elif bpm < 161 %}
                  limegreen
                {% elif bpm < 172 %}
                  orange
                {% else %}
                  orangered
                {% endif %}
            grid_options:
              columns: 12
              rows: auto
            entity2: sensor.whoop_andrew_last_workout_average_hr
            inner:
              gradient: false
              mode: severity
              min: 60
              max: '{{states(''sensor.whoop_andrew_max_heart_rate'')}}'
              segments:
                - from: 0
                  color: cornflowerblue
            setpoint:
              value: '{{states(''sensor.whoop_andrew_max_heart_rate'')}}'
              color: blue

Whoop Day Heart Rate (Gauge Card Pro and Mini Graph Card in Horizontal Stack)
- type: custom:gauge-card-pro
            entity: sensor.whoop_andrew_day_max_heart_rate
            needle: true
            gradient: false
            min: 60
            max: '{{states(''sensor.whoop_andrew_max_heart_rate'')}}'
            segments:
              - from: 0
                color: white
              - from: 118
                color: lightcyan
              - from: 140
                color: skyblue
              - from: 151
                color: limegreen
              - from: 161
                color: orange
              - from: 172
                color: orangered
            titles:
              primary: >
                {% set bpm = states('sensor.whoop_andrew_day_max_heart_rate') |
                float(default=0) %} {% if bpm < 118 %}
                  Day Max HR - Resting Zone 0
                {% elif bpm < 140 %}
                  Day Max HR - Light  Zone 1
                {% elif bpm < 151 %}
                  Day Max HR - Moderate  Zone 2
                {% elif bpm < 161 %}
                  Day Max HR - High Zone 3
                {% elif bpm < 172 %}
                  Day Max HR - Very High Zone 4
                {% else %}
                  Day Max HR - Peak Zone 5
                {% endif %}
              secondary: >
                {% set bpm =
                states('sensor.whoop_andrew_day_average_heart_rate') |
                float(default=0) %} {% if bpm < 118 %}
                  Day Avg HR - Resting Zone 0
                {% elif bpm < 140 %}
                  Day Avg HR - Light  Zone 1
                {% elif bpm < 151 %}
                  Day Avg HR - Moderate  Zone 2
                {% elif bpm < 161 %}
                  Day Avg HR - High Zone 3
                {% elif bpm < 172 %}
                  Day Avg HR - Very High Zone 4
                {% else %}
                  Day Avg HR - Peak Zone 5
                {% endif %}
              primary_color: >
                {% set bpm = states('sensor.whoop_andrew_day_max_heart_rate') |
                float(default=0) %} {% if bpm < 118 %}
                  white
                {% elif bpm < 140 %}
                  lightcyan
                {% elif bpm < 151 %}
                  skyblue
                {% elif bpm < 161 %}
                  limegreen
                {% elif bpm < 172 %}
                  orange
                {% else %}
                  orangered
                {% endif %}
              secondary_color: >
                {% set bpm =
                states('sensor.whoop_andrew_day_average_heart_rate') |
                float(default=0) %} {% if bpm < 118 %}
                  white
                {% elif bpm < 140 %}
                  lightcyan
                {% elif bpm < 151 %}
                  skyblue
                {% elif bpm < 161 %}
                  limegreen
                {% elif bpm < 172 %}
                  orange
                {% else %}
                  orangered
                {% endif %}
            value_texts:
              primary_color: >
                {% set bpm = states('sensor.whoop_andrew_day_max_heart_rate') |
                float(default=0) %} {% if bpm < 118 %}
                  white
                {% elif bpm < 140 %}
                  lightcyan
                {% elif bpm < 151 %}
                  skyblue
                {% elif bpm < 161 %}
                  limegreen
                {% elif bpm < 172 %}
                  orange
                {% else %}
                  orangered
                {% endif %}
              secondary_color: cornflowerblue
            grid_options:
              columns: 12
              rows: auto
            entity2: sensor.whoop_andrew_day_average_heart_rate
            inner:
              gradient: false
              mode: severity
              min: 60
              max: '{{states(''sensor.whoop_andrew_max_heart_rate'')}}'
              segments:
                - from: 0
                  color: cornflowerblue
          - type: horizontal-stack
            cards:
              - type: custom:mini-graph-card
                name: Week Avg Heart Rate (bpm)
                entities:
                  - entity: sensor.whoop_andrew_day_average_heart_rate
                    name: Average
                show:
                  labels_secondary: hover
                  state: false
                  name: true
                  icon: false
                  extrema: true
                  average: true
                limits:
                  min: 60
                  max: '{{ states(''sensor.whoop_andrew_max_heart_rate'') }}'
                color_thresholds:
                  - value: 0
                    color: white
                  - value: 118
                    color: lightcyan
                  - value: 140
                    color: skyblue
                  - value: 151
                    color: limegreen
                  - value: 161
                    color: orange
                  - value: 172
                    color: orangered
                font_size: 80
                height: 100
                hours_to_show: 168
                points_per_hour: 4
                group: true
              - type: custom:mini-graph-card
                name: Week Max Heart Rate (bpm)
                entities:
                  - entity: sensor.whoop_andrew_day_max_heart_rate
                    name: Max
                show:
                  labels_secondary: hover
                  state: false
                  name: true
                  icon: false
                  extrema: true
                  average: true
                limits:
                  min: 60
                  max: '{{ states(''sensor.whoop_andrew_max_heart_rate'') }}'
                color_thresholds:
                  - value: 0
                    color: white
                  - value: 118
                    color: lightcyan
                  - value: 140
                    color: skyblue
                  - value: 151
                    color: limegreen
                  - value: 161
                    color: orange
                  - value: 172
                    color: orangered
                font_size: 80
                height: 100
                hours_to_show: 168
                points_per_hour: 4
                group: true

Whoop Kilojoules (Gauge Card Pro and Mini Graph Card)
- type: custom:gauge-card-pro
            entity: sensor.whoop_andrew_day_kilojoules
            min: 0
            max: 14000
            needle: true
            gradient: false
            segments:
              - from: 0
                color: gray
              - from: 4184
                color: purple
              - from: 7531
                color: blue
              - from: 9205
                color: limegreen
              - from: 11297
                color: yellowgreen
              - from: 12552
                color: gold
            titles:
              primary: Daily Calories Burned
              secondary: >-
                Last Workout {{
                (states('sensor.whoop_andrew_last_workout_kilojoules') | float)
                | round(0) }} kJ
            value_texts:
              primary: >-
                {{ (states('sensor.whoop_andrew_day_kilojoules') | float) |
                round(0) }}
              primary_unit: kJ
              secondary: >-
                {% set kJ = states('sensor.whoop_andrew_day_kilojoules') |
                float(default=0) %} {% if kJ <= 4184 %}
                  Very Low
                {% elif kJ <= 7531 %}
                  Low
                {% elif kJ <= 9205 %}
                  Lightly Active
                {% elif kJ <= 11297 %}
                  Moderate
                {% elif kJ <= 12552 %}
                  Very Active
                {% else %}
                  Super Active
                {% endif %}
              secondary_color: >-
                {% set kJ = states('sensor.whoop_andrew_day_kilojoules') |
                float(default=0) %} {% if kJ <= 4184 %}
                  gray
                {% elif kJ <= 7531 %}
                  purple
                {% elif kJ <= 9205 %}
                  blue
                {% elif kJ <= 11297 %}
                  limegreen
                {% elif kJ <= 12552 %}
                  gold
                {% else %}
                  gold
                {% endif %}
            grid_options:
              columns: 12
              rows: auto
            entity2: sensor.whoop_andrew_last_workout_kilojoules
            inner:
              mode: severity
          - type: custom:mini-graph-card
            entities:
              - entity: sensor.whoop_andrew_day_kilojoules
                name: Daily Kilojoules (kJ)
            show:
              graph: bar
              name: true
              extrema: true
              average: true
              state: false
              icon: false
            limits:
              min: 0
              max: 4000
            color_thresholds:
              - value: 4184
                color: gray
              - value: 7531
                color: purple
              - value: 9205
                color: blue
              - value: 11297
                color: limegreen
              - value: 12552
                color: lime
              - value: 16736
                color: gold
            font_size: 80
            height: 113
            hours_to_show: 168
            points_per_hour: 0.0417
            group: true

HA Companion Daily Distance (Gauge Card Pro and Mini Graph Card)
- type: custom:gauge-card-pro
            entity: sensor.cph2271_daily_distance
            min: 0
            max: 16000
            needle: true
            gradient: false
            segments:
              - from: 0
                color: gray
              - from: 4000
                color: darkorange
              - from: 6000
                color: gold
              - from: 8000
                color: yellowgreen
              - from: 10000
                color: limegreen
              - from: 12000
                color: green
            titles:
              primary: Daily Distance
              secondary: >-
                {{ (states('sensor.cph2271_daily_steps') | float) | round(0) }}
                Steps
            value_texts:
              primary: >-
                {{ (states('sensor.cph2271_daily_distance') | float) | round(0)
                / 1000 }}
              primary_unit: km
              secondary: >-
                {% set dist = states('sensor.cph2271_daily_distance') |
                float(default=0) %} {% if dist < 4000 %}
                  Very Low
                {% elif dist < 6000 %}
                  Low
                {% elif dist < 8000 %}
                  Fair
                {% elif dist < 10000 %}
                  Good
                {% elif dist < 12000 %}
                  Very Good
                {% else %}
                  Excellent
                {% endif %}
              secondary_color: >-
                {% set dist = states('sensor.cph2271_daily_distance') |
                float(default=0) %} {% if dist < 4000 %}
                  gray
                {% elif dist < 6000 %}
                  darkorange
                {% elif dist < 8000 %}
                  gold
                {% elif dist < 10000 %}
                  yellowgreen
                {% elif dist < 12000 %}
                  limegreen
                {% else %}
                  green
                {% endif %}
            grid_options:
              columns: 12
              rows: auto
            entity2: sensor.cph2271_daily_steps
            inner:
              mode: severity
          - type: custom:mini-graph-card
            entities:
              - entity: sensor.cph2271_daily_distance
                name: Daily Distance (m)
                unit: m
            show:
              graph: bar
              name: true
              extrema: true
              average: true
              state: false
              icon: false
            limits:
              min: 0
              max: 16000
            color_thresholds:
              - value: 0
                color: gray
              - value: 3200
                color: darkorange
              - value: 4800
                color: gold
              - value: 6000
                color: yellowgreen
              - value: 8000
                color: limegreen
              - value: 9600
                color: green
            font_size: 80
            height: 113
            hours_to_show: 168
            points_per_hour: 0.0417
            group: true

HA Companion Sleep Duration (Gauge Card Pro)
- type: custom:gauge-card-pro
            entity: sensor.cph2271_sleep_duration
            min: 0
            max: 650
            needle: true
            gradient: false
            segments:
              - from: 0
                color: gray
              - from: 360
                color: darkorange
              - from: 420
                color: yellowgreen
              - from: 540
                color: limegreen
              - from: 600
                color: darkcyan
            titles:
              primary: Sleep Today
            value_texts:
              primary: >-
                {{ (states('sensor.cph2271_sleep_duration') | float) | round(0)
                / 60 }}
              primary_unit: hrs
              secondary: >-
                {% set mins = states('sensor.cph2271_sleep_duration') |
                float(default=0) %} {% if mins < 360 %}
                  Very Short
                {% elif mins < 420 %}
                  Short
                {% elif mins < 540 %}
                  Good
                {% elif mins < 600 %}
                  Long
                {% else %}
                  Very Long
                {% endif %}
              secondary_color: >-
                {% set mins = states('sensor.cph2271_sleep_duration') |
                float(default=0) %} {% if mins < 360 %}
                  gray
                {% elif mins < 420 %}
                  darkorange
                {% elif mins < 540 %}
                  yellowgreen
                {% elif mins < 600 %}
                  limegreen
                {% else %}
                  darkcyan
                {% endif %}
            grid_options:
              columns: 12
              rows: auto
            setpoint:
              value: 449.4543166666667

HA Companion kcal (Gauge Card Pro and Mini Graph Card
- type: custom:gauge-card-pro
            entity: sensor.cph2271_total_calories_burned
            min: 0
            max: 4000
            needle: true
            gradient: false
            segments:
              - from: 0
                color: gray
              - from: 1000
                color: purple
              - from: 1801
                color: blue
              - from: 2201
                color: limegreen
              - from: 2701
                color: yellowgreen
              - from: 3001
                color: gold
            titles:
              primary: Daily Calories Burned
              secondary: >-
                Last Activity {{
                (states('sensor.cph2271_active_calories_burned') | float) |
                round(0) }} kcal
            value_texts:
              primary: >-
                {{ (states('sensor.cph2271_total_calories_burned') | float) |
                round(0) }}
              primary_unit: kcal
              secondary: >-
                {% set cal = states('sensor.cph2271_total_calories_burned') |
                float(default=0) %} {% if cal <= 1000 %}
                  Very Low
                {% elif cal <= 1800 %}
                  Low
                {% elif cal <= 2200 %}
                  Lightly Active
                {% elif cal <= 2700 %}
                  Moderate
                {% elif cal <= 3000 %}
                  Very Active
                {% else %}
                  Super Active
                {% endif %}
              secondary_color: >-
                {% set cal = states('sensor.cph2271_total_calories_burned') |
                float(default=0) %}  {% if cal <= 1000 %} gray  {% elif cal <=
                1800 %} purple {% elif cal <= 2200 %} blue  {% elif cal <= 2700
                %} limegreen  {% elif cal <=3000 %} lime  {% else %} gold  {%
                endif %}
            grid_options:
              columns: 12
              rows: auto
            entity2: sensor.cph2271_active_calories_burned
            inner:
              mode: severity
          - type: custom:mini-graph-card
            entities:
              - entity: sensor.cph2271_total_calories_burned
                name: Daily Calories (kcal)
            show:
              graph: bar
              name: true
              extrema: true
              average: true
              state: false
              icon: false
            limits:
              min: 0
              max: 4000
            color_thresholds:
              - value: 1000
                color: gray
              - value: 1800
                color: purple
              - value: 2200
                color: blue
              - value: 2700
                color: limegreen
              - value: 3000
                color: lime
              - value: 4000
                color: gold
            font_size: 80
            height: 113
            hours_to_show: 168
            points_per_hour: 0.0417
            group: true

Whoop Strain vs Recovery (Mini Graph Card)
- type: custom:mini-graph-card
            name: Strain vs Recovery
            entities:
              - entity: sensor.whoop_andrew_day_strain
                name: Strain
                color: '#0093E7'
                show_state: true
                show_indicator: false
                show_fill: false
                show_points: true
                state_adaptive_color: true
                aggregate_func: max
              - entity: sensor.whoop_andrew_recovery_score
                name: Recovery
                show_state: true
                show_indicator: false
                show_graph: true
                show_legend: true
                show_fill: false
                show_points: true
                state_adaptive_color: true
                aggregate_func: max
                y_axis: secondary
            show:
              name: true
              icon: false
              legend: true
              extrema: false
              show_points: true
              fill: fade
              labels: hover
              labels_secondary: hover
              state: true
            color_thresholds:
              - value: 0
                color: '#FF0026'
              - value: 34
                color: '#FFDE00'
              - value: 67
                color: '#16EC06'
            font_size_header: 9
            align_state: left
            hour24: true
            animate: false
            group: true
            smoothing: false
            line_width: 5
            hours_to_show: 168
            group_by: date
            upper_bound: 20
            lower_bound: 0
            upper_bound_secondary: 100
            lower_bound_secondary: 0
            height: 200

1 Like