Help converting msg.object into a readable object for a graph card

Hi guys. I have an incoming message fron accuweather API with the rain forecast for the next 2 hours. I’d like to convert it to something readable for some lovelace graph card but I don’t even know where to start… Dunno how to format the message and don’t know what card to use either. All the graph cards I’ve stumbled upon rely on the history of a sensor to display the card and this should work with custom coordinates, not always dependant on past states since it updates every 15 minutes and displays future states not past ones.

anyways, I have an example message to see if at least I can format it into an easier message.

[
    {
        "StartMinute": 0,
        "EndMinute": 20,
        "CountMinute": 21,
        "MinuteText": "Llueve",
        "Type": "RAIN",
        "TypeId": 0
    },
    {
        "StartMinute": 21,
        "EndMinute": 58,
        "CountMinute": 38,
        "MinuteText": "No llueve",
        "Type": null,
        "TypeId": 0
    },
    {
        "StartMinute": 59,
        "EndMinute": 119,
        "CountMinute": 61,
        "MinuteText": "Llueve",
        "Type": "RAIN",
        "TypeId": 0
    }
]

Thanks in advanced

Your “weird” message is JSON. Start here:

I also find tools like this handy to get your template format:

I believe I didn’t explain myself properly in the first message.

The JSON example is made of three blocks.

  • First block is from minute 0 to minute 20, RAIN.
  • Second block is from minute 21 to minute 58, null or no RAIN.
  • Third block is from minute 59 to minute 119, RAIN.

I want to convert this json into something like the example below or some format that will be readable for a graph card:

[
    {
        "Minute": 0,
        "Type": "RAIN"
    },
    {
        "Minute": 1,
        "Type": "RAIN"
    },

    [........]

    {
        "Minute": 21,
        "Type": "no RAIN"
    },
    {
        "Minute": 22,
        "Type": "no RAIN"
    },

    [........]

    {
        "Minute": 58,
        "Type": "no RAIN"
    },
    {
        "Minute":59,
        "Type": "RAIN"
    },
    {
        "Minute": 60,
        "Type": "RAIN"
    },

    [........]

    {
        "Minute": 119,
        "Type": "RAIN"
    }
]

incoming message is obviously variable. Last minute is always 119, start minute always 0.

How will you present this on the dashboard.
The conversion from first to second json is not hard, but will it be possible to present on the dashboard?

That’s the second thing I’m after. Is there such a custom graph card for lovelace?

That’s what I’m asking you.
Feels a bit unnecessary to create a code that creates your new json and it doesn’t work.

I would focus on that first, then when you have a goal start aiming for it with code.

If there’s no such a card I will “create” one with images (vertical blue bars) templating their position and height according to the json.

Could you please help me converting the json? Without any function node if possible. Many thanks.

It’s not possible without function node.
I doubt you can get that functionality with normal nodes.

Give me a few minutes and I will give it a try.

Is there a particular reason this needs to be done in Node-Red? Are you creating the graph in Node-Red?

Otherwise why not use the RESTful integration in Home assistant to retrieve the data into sensors and then graph it using a suitable graph card.

[{"id":"c1464d9ba71ba5a0","type":"inject","z":"ebaa69a9.649708","name":"","props":[{"p":"payload"},{"p":"topic","vt":"str"}],"repeat":"","crontab":"","once":false,"onceDelay":0.1,"topic":"","payload":"[{\"StartMinute\":0,\"EndMinute\":20,\"CountMinute\":21,\"MinuteText\":\"Llueve\",\"Type\":\"RAIN\",\"TypeId\":0},{\"StartMinute\":21,\"EndMinute\":58,\"CountMinute\":38,\"MinuteText\":\"No llueve\",\"Type\":null,\"TypeId\":0},{\"StartMinute\":59,\"EndMinute\":119,\"CountMinute\":61,\"MinuteText\":\"Llueve\",\"Type\":\"RAIN\",\"TypeId\":0}]","payloadType":"json","x":170,"y":2460,"wires":[["1f1e1456443878be"]]},{"id":"1f1e1456443878be","type":"function","z":"ebaa69a9.649708","name":"","func":"var result = [];\nfor (var i in msg.payload) {\n    \n    start = msg.payload[i].StartMinute;\n    end = msg.payload[i].EndMinute;\n    type = msg.payload[i].Type;\n    \n    for (let j = start; j <= end; j++) {\n        result.push({\"minute\": j, \"type\": type});\n    }\n    \n    \n}\n\nmsg.result = result;\nreturn msg;","outputs":1,"noerr":0,"initialize":"","finalize":"","libs":[],"x":360,"y":2480,"wires":[["98be785b1d01e139"]]},{"id":"98be785b1d01e139","type":"debug","z":"ebaa69a9.649708","name":"","active":true,"tosidebar":true,"console":false,"tostatus":false,"complete":"true","targetType":"full","statusVal":"","statusType":"auto","x":350,"y":2380,"wires":[]}]
var result = [];
for (var i in msg.payload) {
    
    start = msg.payload[i].StartMinute;
    end = msg.payload[i].EndMinute;
    type = msg.payload[i].Type;
    
    for (let j = start; j <= end; j++) {
        result.push({"minute": j, "type": type});
    }
    
    
}

msg.result = result;
return msg;

1 Like

I like NR better. I don’t need to restart the system every time I update the sensor config. On top of that, how would you achieve what @Hellis81 posted in his last message with the restful integration?

@Hellis81 Thanks a lot mate, that’s just it. I guess I need to learn about the function node way more. Thanks

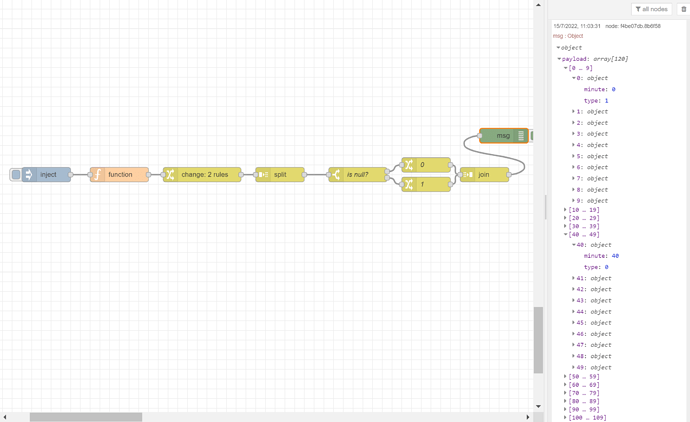
Just one more thing Hellis81, I hope I’m not abusing you. Regarding that later array you built, the one with 120 entries. I replaced the value “RAIN” with the number 1 and null with number 0.

[{"id":"c1464d9ba71ba5a0","type":"inject","z":"878e74c2.7f39c8","name":"","props":[{"p":"payload"},{"p":"topic","vt":"str"}],"repeat":"","crontab":"","once":false,"onceDelay":0.1,"topic":"","payload":"[{\"StartMinute\":0,\"EndMinute\":20,\"CountMinute\":21,\"MinuteText\":\"Llueve\",\"Type\":\"RAIN\",\"TypeId\":0},{\"StartMinute\":21,\"EndMinute\":58,\"CountMinute\":38,\"MinuteText\":\"No llueve\",\"Type\":null,\"TypeId\":0},{\"StartMinute\":59,\"EndMinute\":119,\"CountMinute\":61,\"MinuteText\":\"Llueve\",\"Type\":\"RAIN\",\"TypeId\":0}]","payloadType":"json","x":290,"y":4160,"wires":[["1f1e1456443878be"]]},{"id":"1f1e1456443878be","type":"function","z":"878e74c2.7f39c8","name":"","func":"var result = [];\nfor (var i in msg.payload) {\n    \n    start = msg.payload[i].StartMinute;\n    end = msg.payload[i].EndMinute;\n    type = msg.payload[i].Type;\n    \n    for (let j = start; j <= end; j++) {\n        result.push({\"minute\": j, \"type\": type});\n    }\n    \n    \n}\n\nmsg.result = result;\nreturn msg;","outputs":1,"noerr":0,"initialize":"","finalize":"","x":440,"y":4160,"wires":[["cc22b259.9b3ff"]]},{"id":"cc22b259.9b3ff","type":"change","z":"878e74c2.7f39c8","name":"","rules":[{"t":"set","p":"payload","pt":"msg","to":"result","tot":"msg"},{"t":"delete","p":"result","pt":"msg"}],"action":"","property":"","from":"","to":"","reg":false,"x":610,"y":4160,"wires":[["87a694fb.fdeda8"]]},{"id":"87a694fb.fdeda8","type":"split","z":"878e74c2.7f39c8","name":"","splt":"\\n","spltType":"str","arraySplt":1,"arraySpltType":"len","stream":false,"addname":"","x":770,"y":4160,"wires":[["f6ed8f30.f72e7"]]},{"id":"f6ed8f30.f72e7","type":"switch","z":"878e74c2.7f39c8","name":"is null?","property":"payload.type","propertyType":"msg","rules":[{"t":"null"},{"t":"else"}],"checkall":"false","repair":false,"outputs":2,"x":930,"y":4160,"wires":[["a9577fe1.c48fa"],["2d6dd936.0467b6"]]},{"id":"a9577fe1.c48fa","type":"change","z":"878e74c2.7f39c8","name":"0","rules":[{"t":"set","p":"payload.type","pt":"msg","to":"0","tot":"num"}],"action":"","property":"","from":"","to":"","reg":false,"x":1070,"y":4140,"wires":[["edd5dd8f.897f9"]]},{"id":"2d6dd936.0467b6","type":"change","z":"878e74c2.7f39c8","name":"1","rules":[{"t":"set","p":"payload.type","pt":"msg","to":"1","tot":"num"}],"action":"","property":"","from":"","to":"","reg":false,"x":1070,"y":4180,"wires":[["edd5dd8f.897f9"]]},{"id":"edd5dd8f.897f9","type":"join","z":"878e74c2.7f39c8","name":"","mode":"auto","build":"string","property":"payload","propertyType":"msg","key":"topic","joiner":"\\n","joinerType":"str","accumulate":"false","timeout":"","count":"","reduceRight":false,"x":1190,"y":4160,"wires":[["f4be07db.8b6f58"]]},{"id":"f4be07db.8b6f58","type":"debug","z":"878e74c2.7f39c8","name":"","active":true,"tosidebar":true,"console":false,"tostatus":false,"complete":"true","targetType":"full","statusVal":"","statusType":"auto","x":1230,"y":4080,"wires":[]}]

Now I’d like to get the first 10 values of the type field, get the average and place it in a new array. Then the second 10 values, average, and place it in the new array so I end up with something like this:

{
    "0": {
        "type": 0.75
    },
    "1": {
        "type": 0.95
    },
    "2": {
        "type": 0.60
    },
    "3": {
        "type": 0.1
    },
    "4": {
        "type": 0
    },
    "5": {
        "type": 0.2
    },
    "6": {
        "type": 0.75
    },
    "7": {
        "type": 0.2
    },
    "8": {
        "type": 0.8
    },
    "9": {
        "type": 1
    },
    "10": {
        "type": 1
    },
    "11": {
        "type": 1
    },
    "12": {
        "type": 0.3
    }

}

I guess that’s possible?

I assume you didn’t really need all those extra nodes?

So we are back to this:
image

[{"id":"4ed570b92d6a5c25","type":"inject","z":"ebaa69a9.649708","name":"","props":[{"p":"payload"},{"p":"topic","vt":"str"}],"repeat":"","crontab":"","once":false,"onceDelay":0.1,"topic":"","payload":"[{\"StartMinute\":0,\"EndMinute\":20,\"CountMinute\":21,\"MinuteText\":\"Llueve\",\"Type\":\"RAIN\",\"TypeId\":0},{\"StartMinute\":21,\"EndMinute\":58,\"CountMinute\":38,\"MinuteText\":\"No llueve\",\"Type\":null,\"TypeId\":0},{\"StartMinute\":59,\"EndMinute\":119,\"CountMinute\":61,\"MinuteText\":\"Llueve\",\"Type\":\"RAIN\",\"TypeId\":0}]","payloadType":"json","x":110,"y":2960,"wires":[["a610abebb21a70f8"]]},{"id":"a610abebb21a70f8","type":"function","z":"ebaa69a9.649708","name":"","func":"var result = [];\nfor (var i in msg.payload) {\n    \n    start = msg.payload[i].StartMinute;\n    end = msg.payload[i].EndMinute;\n    if (msg.payload[i].Type == \"RAIN\"){\n        type = 1;\n    }else{\n        type = 0;\n    }\n    \n    \n    for (let j = start; j <= end; j++) {\n        result.push({\"minute\": j, \"type\": type});\n    }\n}\n\nvar avg = [];\nj = 1;\nvar sum =0;\nfor (var k in result){\n    sum += result[k][\"type\"];\n    if(j % 10 == 0){\n        avg.push(sum/10);\n        sum = 0;\n    }\n    j++;\n}\n\nmsg.avg = avg;\nmsg.result = result;\nreturn msg;","outputs":1,"noerr":0,"initialize":"","finalize":"","libs":[],"x":260,"y":2960,"wires":[["98c9fbf19d59dae8"]]},{"id":"98c9fbf19d59dae8","type":"debug","z":"ebaa69a9.649708","name":"","active":true,"tosidebar":true,"console":false,"tostatus":false,"complete":"true","targetType":"full","statusVal":"","statusType":"auto","x":430,"y":2960,"wires":[]}]

With this function:

var result = [];
for (var i in msg.payload) {
    
    start = msg.payload[i].StartMinute;
    end = msg.payload[i].EndMinute;
    if (msg.payload[i].Type == "RAIN"){
        type = 1;
    }else{
        type = 0;
    }
    
    
    for (let j = start; j <= end; j++) {
        result.push({"minute": j, "type": type});
    }
}

var avg = [];
j = 1;
var sum =0;
for (var k in result){
    sum += result[k]["type"];
    if(j % 10 == 0){
        avg.push(sum/10);
        sum = 0;
    }
    j++;
}

msg.avg = avg;
msg.result = result;
return msg;

That’s just it, brilliant, thank a lot.

I love so much the end results man, thanks again for your help.

grafica_minutecast

That’s cool!
Do you mind sharing the card config?

Sure sir, it might be a little cumbersome to understand but if there’s anything I can help with please let me know. You’ll need card mod to make it work and a self made transparent image for the bars and background. The rest is code.

sensor.ui_minutecast_bars is a sensor I made populated with the array you helped me with. It has 12 attributes, one for each bar. This attribute is a value between 0 and 1 which is used to dynamically change the position of the images. This value represents the probability of rain for every 10 minute period. Make a dumb sensor for testing purposes, otherwise it won’t work.

EDIT

when I try to upload the two transparent images I used, nothing shows up :S. Create a couple of transparent images, Paint 3D will do it.

294px wide x 200px height for barras_minutecast_background.png

20px x 100px for barra_minutecast.png

place them both whithin the www folder

YAML:

- type: picture-elements
  image: /local/barras_minutecast_background.png
  style: |
    ha-card {
        background-color: rgba(0,0,0,0);


        {% set top_referencia = 235 %}
        {% set barras_height = 75 %}
        --top-barra-1: {{ top_referencia|int - (state_attr('sensor.ui_minutecast_bars','barra_1')|float*barras_height|float) }}px;
        --top-barra-2: {{ top_referencia|int - (state_attr('sensor.ui_minutecast_bars','barra_2')|float*barras_height|float) }}px;
        --top-barra-3: {{ top_referencia|int - (state_attr('sensor.ui_minutecast_bars','barra_3')|float*barras_height|float) }}px;
        --top-barra-4: {{ top_referencia|int - (state_attr('sensor.ui_minutecast_bars','barra_4')|float*barras_height|float) }}px;
        --top-barra-5: {{ top_referencia|int - (state_attr('sensor.ui_minutecast_bars','barra_5')|float*barras_height|float) }}px;
        --top-barra-6: {{ top_referencia|int - (state_attr('sensor.ui_minutecast_bars','barra_6')|float*barras_height|float) }}px;
        --top-barra-7: {{ top_referencia|int - (state_attr('sensor.ui_minutecast_bars','barra_7')|float*barras_height|float) }}px;
        --top-barra-8: {{ top_referencia|int - (state_attr('sensor.ui_minutecast_bars','barra_8')|float*barras_height|float) }}px;
        --top-barra-9: {{ top_referencia|int - (state_attr('sensor.ui_minutecast_bars','barra_9')|float*barras_height|float) }}px;
        --top-barra-10: {{ top_referencia|int - (state_attr('sensor.ui_minutecast_bars','barra_10')|float*barras_height|float) }}px;
        --top-barra-11: {{ top_referencia|int - (state_attr('sensor.ui_minutecast_bars','barra_11')|float*barras_height|float) }}px;
        --top-barra-12: {{ top_referencia|int - (state_attr('sensor.ui_minutecast_bars','barra_12')|float*barras_height|float) }}px;

        {% set left_referencia = 15 %}
        {% set espaciado = 24 %}
        --left-barra-1: {{left_referencia}}px;
        --left-barra-2: {{left_referencia|float + espaciado|float*1 }}px;
        --left-barra-3: {{left_referencia|float + espaciado|float*2 }}px;
        --left-barra-4: {{left_referencia|float + espaciado|float*3 }}px;
        --left-barra-5: {{left_referencia|float + espaciado|float*4 }}px;
        --left-barra-6: {{left_referencia|float + espaciado|float*5 }}px;
        --left-barra-7: {{left_referencia|float + espaciado|float*6 }}px;
        --left-barra-8: {{left_referencia|float + espaciado|float*7 }}px;
        --left-barra-9: {{left_referencia|float + espaciado|float*8 }}px;
        --left-barra-10: {{left_referencia|float + espaciado|float*9 }}px;
        --left-barra-11: {{left_referencia|float + espaciado|float*10 }}px;
        --left-barra-12: {{left_referencia|float + espaciado|float*11 }}px;
    }
  elements:

    # Barra 1 #

    - type: image
      image: /local/barra_minutecast.png
      style:
        top: var(--top-barra-1)
        left: var(--left-barra-1)
        width: 20px
        background-color: rgba(179,223,240,1)
        border-radius: 15px
        filter: '${ "grayscale(" + (100 - states[''sensor.ui_minutecast_bars''].attributes.barra_1*100) + "%)"}'
        opacity: '${ 20 + states[''sensor.ui_minutecast_bars''].attributes.barra_1*80 + "%"}'

    # Barra 2 #

    - type: image
      image: /local/barra_minutecast.png
      style:
        top: var(--top-barra-2)
        left: var(--left-barra-2)
        width: 20px
        background-color: rgba(179,223,240,1)
        border-radius: 15px
        filter: '${ "grayscale(" + (100 - states[''sensor.ui_minutecast_bars''].attributes.barra_2*100) + "%)"}'
        opacity: '${ 20 + states[''sensor.ui_minutecast_bars''].attributes.barra_2*80 + "%"}'

    # Barra 3 #

    - type: image
      image: /local/barra_minutecast.png
      style:
        top: var(--top-barra-3)
        left: var(--left-barra-3)
        width: 20px
        background-color: rgba(179,223,240,1)
        border-radius: 15px
        filter: '${ "grayscale(" + (100 - states[''sensor.ui_minutecast_bars''].attributes.barra_3*100) + "%)"}'
        opacity: '${ 20 + states[''sensor.ui_minutecast_bars''].attributes.barra_3*80 + "%"}'

    # Barra 4 #

    - type: image
      image: /local/barra_minutecast.png
      style:
        top: var(--top-barra-4)
        left: var(--left-barra-4)
        width: 20px
        background-color: rgba(179,223,240,1)
        border-radius: 15px
        filter: '${ "grayscale(" + (100 - states[''sensor.ui_minutecast_bars''].attributes.barra_4*100) + "%)"}'
        opacity: '${ 20 + states[''sensor.ui_minutecast_bars''].attributes.barra_4*80 + "%"}'

    # Barra 5 #

    - type: image
      image: /local/barra_minutecast.png
      style:
        top: var(--top-barra-5)
        left: var(--left-barra-5)
        width: 20px
        background-color: rgba(179,223,240,1)
        border-radius: 15px
        filter: '${ "grayscale(" + (100 - states[''sensor.ui_minutecast_bars''].attributes.barra_5*100) + "%)"}'
        opacity: '${ 20 + states[''sensor.ui_minutecast_bars''].attributes.barra_5*80 + "%"}'

    # Barra 6 #

    - type: image
      image: /local/barra_minutecast.png
      style:
        top: var(--top-barra-6)
        left: var(--left-barra-6)
        width: 20px
        background-color: rgba(179,223,240,1)
        border-radius: 15px
        filter: '${ "grayscale(" + (100 - states[''sensor.ui_minutecast_bars''].attributes.barra_6*100) + "%)"}'
        opacity: '${ 20 + states[''sensor.ui_minutecast_bars''].attributes.barra_6*80 + "%"}'

    # Barra 7 #

    - type: image
      image: /local/barra_minutecast.png
      style:
        top: var(--top-barra-7)
        left: var(--left-barra-7)
        width: 20px
        background-color: rgba(179,223,240,1)
        border-radius: 15px
        filter: '${ "grayscale(" + (100 - states[''sensor.ui_minutecast_bars''].attributes.barra_7*100) + "%)"}'
        opacity: '${ 20 + states[''sensor.ui_minutecast_bars''].attributes.barra_7*80 + "%"}'

    # Barra 8 #

    - type: image
      image: /local/barra_minutecast.png
      style:
        top: var(--top-barra-8)
        left: var(--left-barra-8)
        width: 20px
        background-color: rgba(179,223,240,1)
        border-radius: 15px
        filter: '${ "grayscale(" + (100 - states[''sensor.ui_minutecast_bars''].attributes.barra_8*100) + "%)"}'
        opacity: '${ 20 + states[''sensor.ui_minutecast_bars''].attributes.barra_8*80 + "%"}'

    # Barra 9 #

    - type: image
      image: /local/barra_minutecast.png
      style:
        top: var(--top-barra-9)
        left: var(--left-barra-9)
        width: 20px
        background-color: rgba(179,223,240,1)
        border-radius: 15px
        filter: '${ "grayscale(" + (100 - states[''sensor.ui_minutecast_bars''].attributes.barra_9*100) + "%)"}'
        opacity: '${ 20 + states[''sensor.ui_minutecast_bars''].attributes.barra_9*80 + "%"}'

    # Barra 10 #

    - type: image
      image: /local/barra_minutecast.png
      style:
        top: var(--top-barra-10)
        left: var(--left-barra-10)
        width: 20px
        background-color: rgba(179,223,240,1)
        border-radius: 15px
        filter: '${ "grayscale(" + (100 - states[''sensor.ui_minutecast_bars''].attributes.barra_10*100) + "%)"}'
        opacity: '${ 20 + states[''sensor.ui_minutecast_bars''].attributes.barra_10*80 + "%"}'

    # Barra 11 #

    - type: image
      image: /local/barra_minutecast.png
      style:
        top: var(--top-barra-11)
        left: var(--left-barra-11)
        width: 20px
        background-color: rgba(179,223,240,1)
        border-radius: 15px
        filter: '${ "grayscale(" + (100 - states[''sensor.ui_minutecast_bars''].attributes.barra_11*100) + "%)"}'
        opacity: '${ 20 + states[''sensor.ui_minutecast_bars''].attributes.barra_11*80 + "%"}'

    # Barra 12 #

    - type: image
      image: /local/barra_minutecast.png
      style:
        top: var(--top-barra-12)
        left: var(--left-barra-12)
        width: 20px
        background-color: rgba(179,223,240,1)
        border-radius: 15px
        filter: '${ "grayscale(" + (100 - states[''sensor.ui_minutecast_bars''].attributes.barra_12*100) + "%)"}'
        opacity: '${ 20 + states[''sensor.ui_minutecast_bars''].attributes.barra_12*80 + "%"}'

Regarding the variables:

  • top_referencia is the absolute top px position when rain probability is 0.
  • barras_height is the maximum number of px the bars will be moved upwards when rain probability is 1.
  • left_referencia is the absolute left position in px of the first bar starting from the left.
  • espaciado is the spacing in px between bars

Regarding the sensor

sensor.ui_minutecast_bars looks like in the picture below. Create one and play around moving values between 0 and 1 for each attribute.

1 Like