Help Required - Analog Dial 'Dumb' Gas Meter Monitor (for a 1991 UGI Gas Meters Ltd analog meter)

Not what you want to read, but you shouldn’t have a meter that old. Gas meters have a certified life of either 10 or 25 years, which it exceeds on both counts. That means it could be inaccurate or dangerous.

Speak to your energy supplier again and demand the replacement. Inform them that if they fail to replace again then a formal complaint will be made on safety grounds. If they still don’t budge then speak to the regulator/ombudsman and you will find things move very quickly. You may not get a smart meter, but they should change it for something more modern as it is potentially dangerous. I did the same at a property I own and it was replaced in four hours.

Do you have a gas leak detector down there? If not then I would get one tomorrow.

It is not uncommon that such meters have a rotating magnet beneath the dial. (Although I am not sure about that in 1991).
You could try to attach a reed-switch or a maybe a halleffect sensor outside the case. They will work with your existing ESP and show way better edges than the ir sensor.

And then there is GitHub - jomjol/AI-on-the-edge-device which will read the meter by camera and interpret the numbers

I have documented my journey in integrating my gas & water meter here step by step: Geert Meersman / energy-meter · GitLab
For the water meter i use a proximity sensor, and for the gas meter I use a TCRT5000 meter.

Hi Geert,

Thanks for adding to the thread with a very useful step-by-step guide to your solution.

I checked your YAML code and it is pretty much the same as the code I am using, and it works well and is accurate. My problem is that my meter indicator dial moves at two different speeds - fast when the burner is lit, and slow when the burner is at idle. The burner is lit, and the needle is moving fast, the counter works flawlessly. The problem arises when the dial is moving slowly when the boiler is idling, this is when the rate of passage of the needle below the TCRT5000 sensor is too slow and allows multiple triggers to occur… which increases the total pulse counter when it really shouldn’t.

I like your use of the proximity sensor… I may get one and see if this will be triggered by the moving needle on my meter rotating dial. :+1:t2:

Thanks for the input,

Mike.

Hi,
well I must say that I also had some extra pulses, so I am playing a bit with the position of the proximity sensor. Now it did run 1 day without ghost pulses, let’s see how it continues :slight_smile:
With the TCRT5000 sensor I also had them, but I changed the position with 90°, as I think that when the rotary dial with mirror passes too slowly or stops, it could get some of these extra pulses. So I hope that having it now in a different set up, it will be better! Will keep you posted

UPDATE ON ORIGINAL POST

After having a bit of a play about over the Christmas holidays and thinking about the best way to get this working I changed the YAML code from that previously posted, or more accurately, changed the C++ code in the Lambda function within the YAML code

I’ve now had this running for over 48 hours and it seems to be logging the needle as it passes under the IR sensor quite accurately now, as can be seen from the screenshots below.

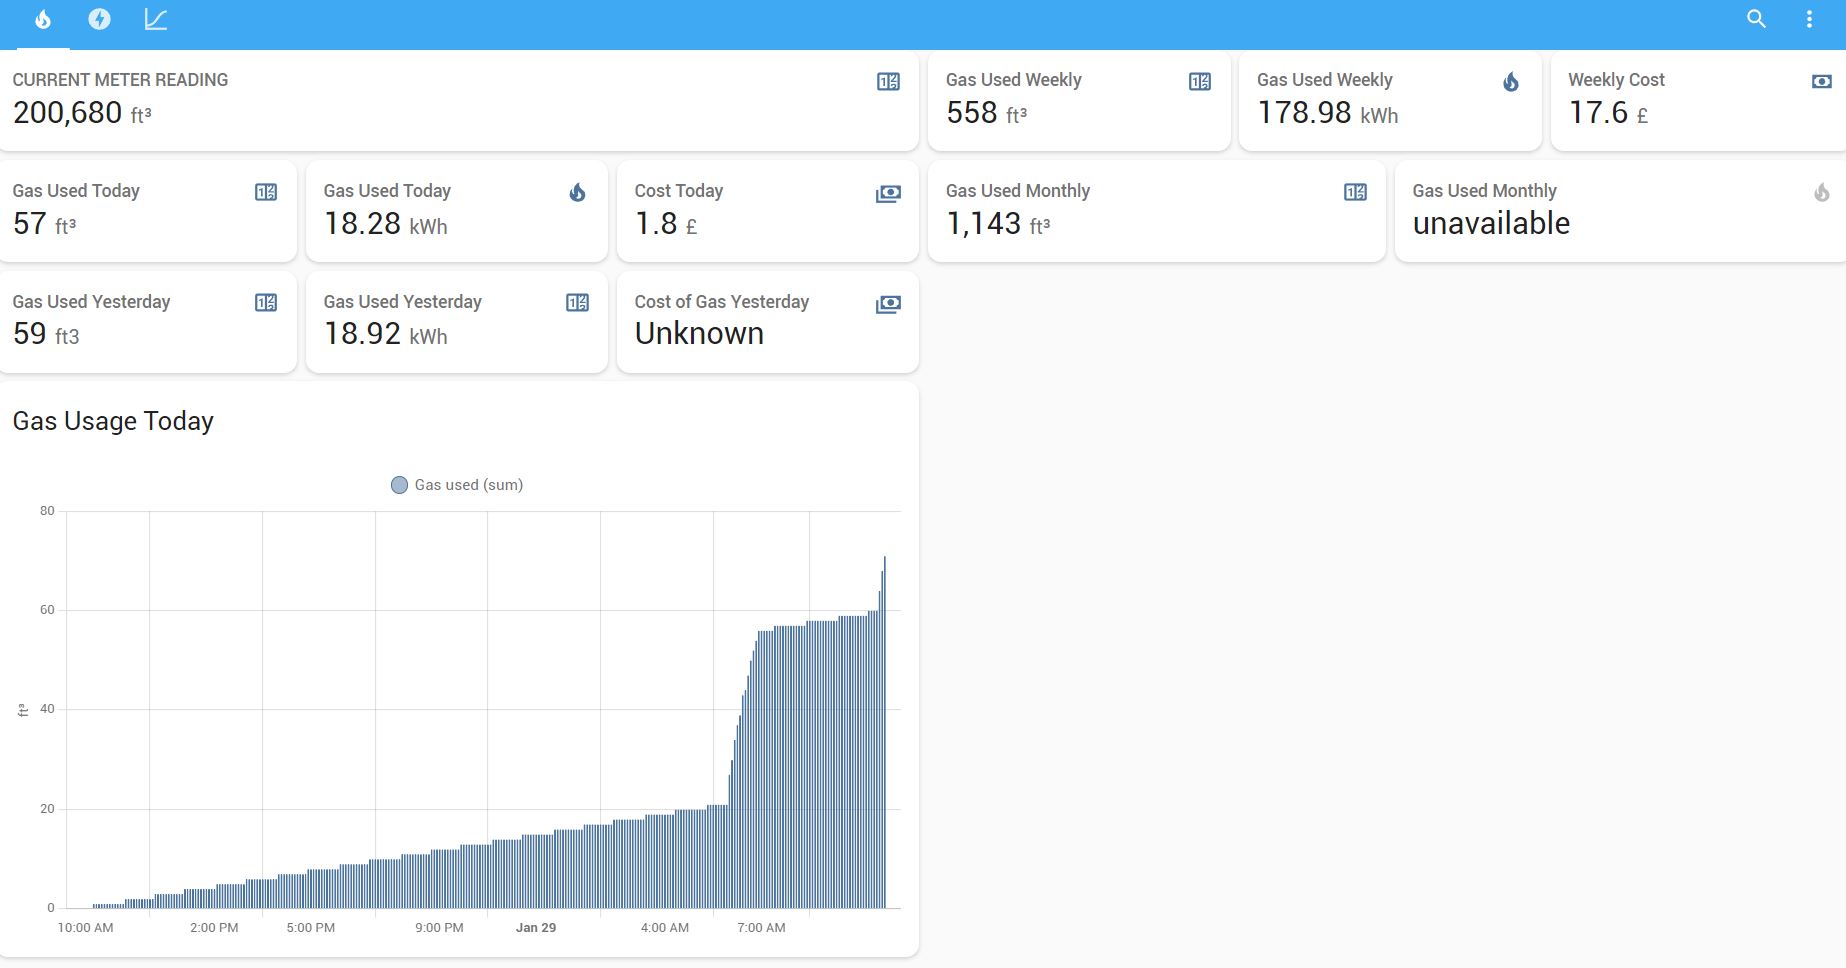
IR Sensor ADC Values


This screen grab shows the values being logged from the ESP32’s ADC using the analog output from the IR sensor. The red vertical sketch line is the last time the ESP32 was reset. The spikes on the graph are the needle passing below the IR sensors emitter and receiver. For clarity, the narrow spikes are when the burner is turned on (needle rotating fast) and the wider spikes are when the burner is off and just the pilot light running (needle running slowly). The darker blue numbers scribbled near the spikes are the number of rotations of the meter dial which equate to 1 ft3 of gas since the last reset (red vertical line). This screenshot shows 11 ft3 used since the last reset of the ESP32.

Actual Logged Consumption
Gas Consumption
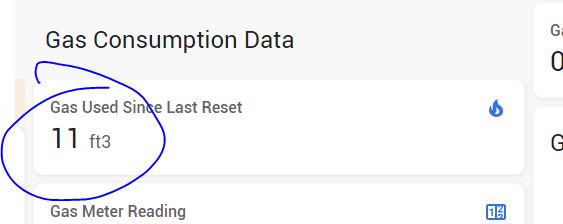
This is a screen grab from HA itself, and the gas consumption figure correlates to the spikes shown on the previous graph, 11 ft3

YAML Code

    name: gas-meter-monitor
  
esp32:
    board: nodemcu-32s

# Enable logging
logger:

# Enable Home Assistant API
api:
  encryption:
    key: "HNNVUMR69RNNJBK9q+LCtVwenVKZpL1en2+jzl0VaHE="

ota:
  password: "a306ebc5fe5e8fb5c286227999570932"

wifi:
  ssid: !secret wifi_ssid
  password: !secret wifi_password

# Enable fallback hotspot (captive portal) in case wifi connection fails
  ap:
    ssid: "Gas-Meter-Monitor"
    password: "kCTrfHhD3FcG"

captive_portal:

globals:
  - id: total_pulses
    type: float
    restore_value: false
    initial_value: '0.0'

  - id: max_pulse_value
    type: float
    restore_value: false
    initial_value: '0.1730'
 
# This sensor exposes the 'total_pulses' variable to Home Assistant and
# tells HA it is to ft³
sensor:
  - platform: template
    name: "Gas used"
    device_class: gas
    unit_of_measurement: "ft³"
    state_class: "total_increasing"
    icon: "mdi:fire"
    accuracy_decimals: 0
    lambda: |-
        return id(total_pulses);

# This is the reading of the voltage on the analog input pin  Take a measurement every 50ms but only report the average 
# every 2 seconds. This is to overcome the noisy ADC on the ESP32, and also to see if the sensor is 'seeing' the rotating needle
  - platform: adc
    id: adc_value
    pin: GPIO32
    accuracy_decimals: 4
    name: "Gas Meter Sensor Analog Value"
    update_interval: 50ms
    attenuation: 11dB 
    filters:
      - throttle_average: 2sec

# When a new voltage measurement is received, calculate the 
# difference with the previous voltage. If it's larger than 
# a certain threshold, increase the pulse counter and also reset the maximum value 
# to the current value for the next needle rotation
    on_value:
      then:
       - lambda: |-

          float current_pulse_value = id(adc_value).state;
          float last_pulse_value = current_pulse_value;
          float diff = id(max_pulse_value) - current_pulse_value;

          if(current_pulse_value > id(max_pulse_value)){
            id(max_pulse_value) = current_pulse_value;
          }
          if(diff > 0.008){
           id(total_pulses) += 1;
           }
          if(diff > 0.008){
           id(max_pulse_value) = current_pulse_value;
           }
   

# Uptime sensor
  - platform: uptime
    name: Gas Meter Uptime

# WiFi Signal sensor
  - platform: wifi_signal
    name: Gas Meter WiFi Signal
    update_interval: 60s

# Switch to restart    
switch:
  - platform: restart
    name: gas meter monitor restart

Brief Explanation of How It Works
When there is no needle under the sensor the ESP 32 reports back a pretty steady voltage level. The ADC is quite noisy but the voltage is read every 50ms and averaged before reporting this every two seconds - smooths it out a bit.

As the needle starts to pass under the IR sensor, the voltage output on the sensor rises and reaches a maximum (in my case) of 0.183 V and after this peak starts to fall back to around 0.172 to 0.174 V - these are the peaks and troughs on the above graph.

As the needle starts to pass under the sensor, the ESP32 checks the current value of the IR sensor and compares it to the max_pulse_value of the IR sensor since the last rotation, and if it is higher, it will log that newer value as max_pulse_value. This means that we can obtain a maximum value from the IR sensor as the needle rotates under it, and we then know that the needle has passed under the sensor.

There is a variable named ‘diff’ which is the difference between the max_pulse_value and the current_pulse_value - this number is changing all the time as the needle rotates and passes under the IR sensor; it will increase and decrease in size as the needle rotates.

What we want to know is this “When has the needle definitely passed the IR sensor”. (and also when it has passed the IR Sensor, then increment the gas consumption figure by 1 ft3). This is done in the Lambda function which is C++ code, not YAML. The IF statements within the Lambda function are used to determine the difference in voltage between high and steady state, that ‘difference’ being 0.008V in my case. If this difference is exceeded, then the needle has passed the IR head as the difference between the peak sensor value and the lower ‘steady state’ value is at it’s maximum level. When this large difference occurs, the total_consumption variable is increased by 1, and max_pulse_value variable is reset to the current level, to enable the next rotation of the dial to be ascertained - and the process starts again.

I hope the above explanation is clear. If anybody wants to use this method the ‘0.008’ figure within the Lambda function will need to be changed to suit your own purposes. It would be best to set up a dashboard where you can monitor the value of the ESP32’s ADC value from the sensor, or you could sit and watch the ESPHome Log scroll past to monitor voltages/ADC values. You will need to find the maximum values and “steady-state” values of your own installation. When the dial passes under the IR Sensor this will provide the maximum value, and when the dial is away from the sensor (180 degrees opposite, it will be the lowest value). It is these ‘max’ & ‘current’ values which determine the ‘diff’ threshold in the Lambda function - and thus the success of the total_consumption variable being increased every time the needle passes the IR Sensor.

I do hope this helps somebody, and please do feel free to respond if you feel I can be of any help at all.

Thanks to all who contributed, and offered suggestions. Your input was much appreciated and valued.

Cheers,

Mike.

Just a further update.

Gas monitoring is working well, and I have created an ‘at a glance’ type dashboard. This contains cards such as ‘Daily Consumption’, ‘Weekly Consumption’, ‘Monthly Consumption’ etc.

In order to do this I first created a “Gas Meter” using the Meter preset in the Helpers section and used the sensor ‘gas_used’ (which is based on the total_pulses variable from the IR sensing head). This Helper is the gas meter, and can be added on a card to the dashboard.

Gas Meter Reading
This is from my gas meter and it reads in hundred’s of ft3 - the actual reading on the dials of my meter is 1994.90x (x= whatever fraction of ft3 the small dial is pointing to)

The problem here is the readings off this meter in the dashboard and the physical gas meter in your house will be different, as the HA Dashboard Meter will only start recording gas used from the time you create it. This is when it should be calibrated to match the existing meter reading.

If you go to Developer Tools > Services and add this yaml (below) to the box, it should replace the current gas meter value with 30208. You would click the ‘Call Service’ button to calibrate with this value you have entered. The value has to be whatever is on your gas meter reading - try and do it when the dials on the meter are static for the best accuracy.

service: utility_meter.calibrate
target:
  entity_id: sensor.gas_meter
data:
  value: '30208'

After doing the calibration is it a simple procedure to then create other Helper Meters to cover Daily, Weekly, and Monthly gas consumption. These Meters can go on separate cards on the Dashboard for ‘at a glance’ reading.

Cheers,

Mike.

Now Added a "at a glance dashboard"

The Gas Meter monitor is now seemingly to be working well and is accurately logging the dial rotations. This is feeding into the standard Energy Dashboard and calculating a cost. As noted above, I decided to create a Dashboard with all the relevant gas consumption figures on it… and here it is.

The next stage for me is to add kWh conversions to each card on the dashboard, and also a cost to each card on the dashboard… that is beyond my experience yet on HA. I will do an update when I manage to get something working though.

Cheers,

Mike.

Now added costs and kWh conversion to ‘Gas’ Dashboard

As noted in my previous post, I was looking to add a kWh figure and a cost figure to my dashboard. I have done this by creating several new ‘sensors’ in my configuration.yaml file, and also by using the Meters Helper to log the information.


‘Gas Dashboard’ as it currently stands…

The additional sensors I created are noted below:-

template:
  - sensor:
      - name: "Daily Gas Consumption kWh"
        unique_id: daily_gas_usage_kwh
        state: "{{ ((((states('sensor.gas_consumption_daily_v2')|float * 0.0283) * 1.02264) * 39.9) / 3.6)|round(2) }}"
        availability: "{{ states('sensor.gas_consumption_daily_v2')|is_number }}" 
        unit_of_measurement: "kWh"
        device_class: energy
        state_class: total

      - name: "Daily Gas Cost"
        unique_id: daily_gas_cost
        state: "{{ (((((states('sensor.gas_consumption_daily_v2')|float * 0.0283) * 1.02264) * 39.9) / 3.6) * 0.09835)|round(2) }}"
        availability: "{{ states('sensor.gas_consumption_daily_v2')|is_number }}" 
        unit_of_measurement: "£"
        device_class: monetary
        state_class: total
  
      - name: "Weekly Gas Consumption kWh"
        unique_id: weekly_gas_usage_kwh
        state: "{{ ((((states('sensor.gas_consumption_weekly_v2')|float * 0.0283) * 1.02264) * 39.9) / 3.6)|round(2) }}"
        availability: "{{ states('sensor.gas_consumption_weekly_v2')|is_number }}" 
        unit_of_measurement: "kWh"
        device_class: energy
        state_class: total

      - name: "Weekly Gas Cost"
        unique_id: weekly_gas_cost
        state: "{{ (((((states('sensor.gas_consumption_weekly_v2')|float * 0.0283) * 1.02264) * 39.9) / 3.6) * 0.09835)|round(2) }}"
        availability: "{{ states('sensor.gas_consumption_weekly_v2')|is_number }}" 
        unit_of_measurement: "£"
        device_class: monetary
        state_class: total

      - name: "Monthly Gas Consumption kWh"
        unique_id: monthly_gas_usage_kwh
        state: "{{ ((((states('sensor.gas_consumption_monthly_v2')|float * 0.0283) * 1.02264) * 39.9) / 3.6)|round(2) }}"
        availability: "{{ states('sensor.gas_consumption_monthly_v2')|is_number }}" 
        unit_of_measurement: "kWh"
        device_class: energy
        state_class: total

      - name: "Monthly Gas Cost"
        unique_id: monthly_gas_cost
        state: "{{ (((((states('sensor.gas_meter_monthly_v2')|float * 0.0283) * 1.02264) * 39.9) / 3.6) * 0.09835)|round(2) }}"
        availability: "{{ states('sensor.gas_meter_monthly_v2')|is_number }}" 
        unit_of_measurement: "£"
        device_class: monetary
        state_class: total

The new sensors take the totals from various Meter type Helpers I created i.e. ‘sensor.gas_consumption_daily_V2’, or ‘sensor.gas_consumption_weekly_V2’, and then undertake either a kWh conversion or a cost conversion on the figures created by the Helpers… and as these costs or kWh ‘sensors’ have unique names, they can be quite readily added to Entity cards in a dashboard for review.

Obviously, if my gas unit rate (we get billed in £/kWh here in the UK) changes, I will have to change the figures in the yaml code, but this isn’t difficult to do.

The next step for me is to add a “Standing Charge” cost… (here in the UK we get billed a fixed amount per day from the gas company, irrespective of how much gas we use - this is £0.2712 with my current gas supplier)… and I could add this into the daily, weekly monthly calculations in order to get a more accurate reflection of what my next bill will look like and also add the 5% VAT (tax) onto the bill too, for even greater accuracy.

I hope this helps somebody, and if anybody does have any questions do feel free to ask, and I’d be more than happy to help out where I can.

Cheers, :+1:t2:

Mike.

1 Like

This is very intriguing. I have a very crude meter (see below), so this won’t work for me.

Did you set up a normal HA integration, a HACS integration, or some other way to import the data?

Hi Will,

I used the ESPHome add-on for HA. I don’t know if you are familiar with ESPHome, but it is a fantastic way to create custom sensors for your Home Assistant setup. I bought some ESP32 WiFi/Bluetooth-enabled microcontrollers from Amazon and used these with other sensors to feed back into HA. You upload code etc to the ESP32 module using the ESPHome add-on. Sounds complicated, but it isn’t really in practice. If I can do it, anybody can! :roll_eyes:

BTW I added a few more thoughts to your initial post on the thread you created earlier.

Cheers,

Mike.

1 Like

I currently have a couple of Kauf bulbs, a couple of Kauf plugs, and a couple of Athom plugs, so have an exposure to ESPHome (and have updated .yaml files, etc), so that’s one very interesting option. Thanks for the tip!

1 Like

I have the exact same gas meter as you, except mine is from 1986 :slight_smile:

I am probably going to try to reproduce your set up, except I will use C++ and a RPi Pico because I prefer to work with that.

Your problem of turning the analog signal into a series of events is a standard signal processing task. Typically you would simply low pass filter the signal and look for maximums (peaks). This is pretty much identical to the solution you found.

Do you have any advice on sensor positioning and mounting? And approximately how fast does the dial turn at maximum? (Thinking about how often I need to sample in order to never miss rotations.)

edit: I’ve been reading up about gas meters and the one we have is called “U6 UGI Black Spot”. Apparently these are known for over-reporting.

Hi Alistair,

Congrats on your “choice” of gas meter!!! :laughing:

In answer to your questions on positioning, see attached photo of where the sensor is located on mine. The red circles I have drawn on are the IR Tx & Rx LED’s… I tried to get them at the 3 O’clock position as this would still enable me to read the meter in order to check the reliability of the logging. (so far, it’s not missed a beat!) and also, on the clear plastic faceplate there is a small, raised perimeter upstand which prevented the 3D-printed sensor housing from moving further over to the right.

Regarding the speed of dial turning… here is a screen grab of the voltage peaks when the burner is on full. You should be able to work out the peak to trough time from the timings logged at the bottom of the graph. I get it to be about 5 or 6 seconds, assuming each step is about two seconds.

I hope that helps, and do feel free to shout up if you need further info - more than happy to help where I can! :+1:t2:

Cheers,

Mike.

1 Like

Are you not using the built in energy dash on HA? I’m trying to work out how to add costs for my meter but need to convert it to kWh first from ft3.

Hi,
Yes, I use the HA Energy Dashboard in addition to my own custom, “at a glance” dashboard.

If using the HA Energy Dashboard it will automatically convert from ft3 into m3, but when you add costs you have to calculate the cost per m3 of gas for it to accurately reflect your usage, although here in UK we get charged by the kWh (this is also another reason why I designed my own dashboard).

In order to get kWh and Cost I put some additional yaml ‘sensors’ in my configuration file to calculate these. If you want me to post the yaml for these, let me know.

Cheers,

Mike

Hi Mike,

Yes please, if you wouldn’t mind!

Morning…

I created a number of 'Helper ’ Meters to track various elements of gas usage and cost, so their results could be shown in my custom dashboard… some of these I did after putting the new yaml code into the configuration file.


Note: The one which says just “Gas Meter” tracks the actual meter reading, and is easy to calibrate by pasting the following into the Developer Tools > Services section of HA and then hitting the ‘Call Service’ button.

service: utility_meter.calibrate
target:
  entity_id: sensor.gas_meter #Change this to your Gas Meter Reading helper sensor
data:
  value: '199870' #Change this to your meter reading

The yaml code for the various other sensors is noted below…


      - name: "Daily Gas Consumption kWh"
        unique_id: daily_gas_usage_kwh
        state: "{{ ((((states('sensor.gas_consumption_daily_v2')|float * 0.0283) * 1.02264) * 39.9) / 3.6)|round(2) }}"
        availability: "{{ states('sensor.gas_consumption_daily_v2')|is_number }}" 
        unit_of_measurement: "kWh"
        device_class: energy
        state_class: total

      - name: "Daily Gas Cost"
        unique_id: daily_gas_cost
        state: "{{ (((((states('sensor.gas_consumption_daily_v2')|float * 0.0283) * 1.02264) * 39.9) / 3.6) * 0.09835)|round(2) }}"
        availability: "{{ states('sensor.gas_consumption_daily_v2')|is_number }}" 
        unit_of_measurement: "£"
        device_class: monetary
        state_class: total
  
      - name: "Weekly Gas Consumption kWh"
        unique_id: weekly_gas_usage_kwh
        state: "{{ ((((states('sensor.gas_consumption_weekly_v2')|float * 0.0283) * 1.02264) * 39.9) / 3.6)|round(2) }}"
        availability: "{{ states('sensor.gas_consumption_weekly_v2')|is_number }}" 
        unit_of_measurement: "kWh"
        device_class: energy
        state_class: total

      - name: "Weekly Gas Cost"
        unique_id: weekly_gas_cost
        state: "{{ (((((states('sensor.gas_consumption_weekly_v2')|float * 0.0283) * 1.02264) * 39.9) / 3.6) * 0.09835)|round(2) }}"
        availability: "{{ states('sensor.gas_consumption_weekly_v2')|is_number }}" 
        unit_of_measurement: "£"
        device_class: monetary
        state_class: total

      - name: "Monthly Gas Consumption kWh"
        unique_id: monthly_gas_usage_kwh
        state: "{{ ((((states('sensor.gas_consumption_monthly_v2')|float * 0.0283) * 1.02264) * 39.9) / 3.6)|round(2) }}"
        availability: "{{ states('sensor.gas_consumption_monthly_v2')|is_number }}" 
        unit_of_measurement: "kWh"
        device_class: energy
        state_class: total

      - name: "Monthly Gas Cost"
        unique_id: monthly_gas_cost
        state: "{{ (((((states('sensor.gas_meter_monthly_v2')|float * 0.0283) * 1.02264) * 39.9) / 3.6) * 0.09835)|round(2) }}"
        availability: "{{ states('sensor.gas_meter_monthly_v2')|is_number }}" 
        unit_of_measurement: "£"
        device_class: monetary
        state_class: total

Obviously, you will need to change the sensor names to match your existing sensor names, or it won’t work!!

As you can see above the kWh conversion use the ‘standard’ conversion from ft3 to kWh as is printed on UK gas bills… the only items which are liable to change are the calorific value of the gas, the 39.9 figure. This is an average of the calorific values from my last 12 months’ gas bills, so will give a very close approximation to the amount used, but it won’t be to the penny.

Also on the costs… the last number in the ‘state’ line of yaml (0.09835 in my case) is the cost per kWh of gas from your gas Co in pence, and you will need to change it to match your cost per kWh from your recent gas bill… additionally, do bear in mind that this would also need to change when they increase their kWh costs too (very unlikely it will ever reduce :roll_eyes: - but we’ll not get into that bone of contention eh?)

The other thing I haven’t got around to doing is adding the Daily Standing Rip-Off Charge, and then tax at 5%… it’s an easy amendment to the yaml code to achieve this.

I hope this helps and is useful in creating your own custom dashboard :+1:t2:

Cheers,

Mike.

1 Like

That’s great, thank you.

I have followed this, and your other thread, and have built and installed it, but am unsure about the pin connections / GPIO between the TCRT5000 and ESP32. Can you advise please?