I’ve been trying for a few days to figure out how to properly setup my energy dashboard and sensors. I am using DCC Hildebrand sensor (which had some issues on it’s own, but I think I may have fixed this) and here is what I observe, but I don’t necessarily understand.
Let’s take for example the sensor which is gathering hourly statistics about consumption:
sensor.dcc_sourced_smart_electricity_meter_cost_today
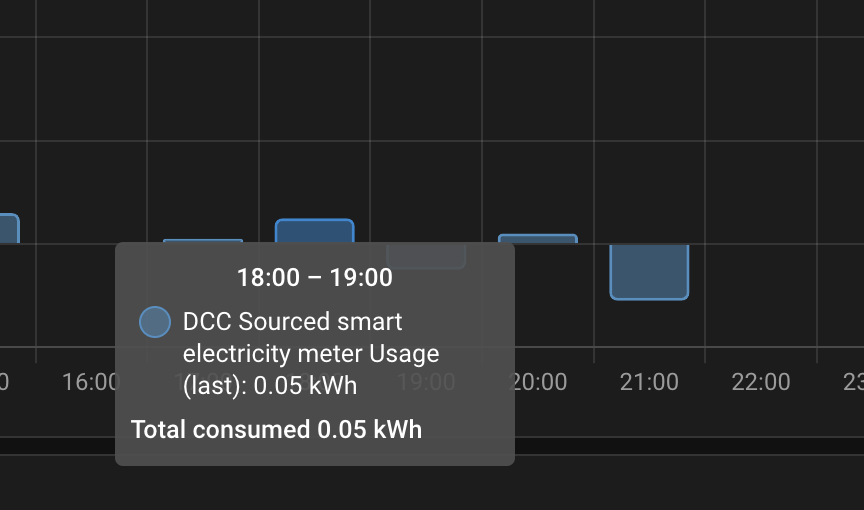
In the history, I can see this:
At 18:18:54 I have recorded consumption of 0.8kWh for the hour. Previous reading (17:18:52) is 0.75. and more interestingly, the reading at 19:18:53 shows 0.75kWh:
Another thing to mention is that if I go to Developer Tools > Statistics and press on recorder for the sensor in question, I see data for times that I know for fact I have not had collected any data
Those ^^ appear every 5 minute, which I have absolutely no idea where are they coming from, but I cannot adjust or see these anywhere else.
I am totally new to home assistant and my apologies of all the above makes sense, it is just so I cannot figure it out… Thanks in advance for your time!
You can’t use that sensor in the energy dashboard. It expects an always increasing energy total. Or a total that resets to zero daily.
If you don’t have a sensor like this, feed your hourly energy sensor to a utility meter helper set to use delta values and no reset cycle. Feed the sensor created by the utility meter to the energy dashboard.
Oh my… Is that what it is … So the value for the sensor must be always increasing with every reading and I can start with a 0 at 00:00 and eventually finish with 80 kWh at the end of the day & then re-set? That makes sense… Can you help me understand the samplings. If I am doing this once every 30min or once every hour, how does this affect the dashboard and the overall readings? What’s the best place to go & read about these things? BTW, I have set the sensor to total right now (and not total_increasing).
I see this is an old thread, but I’m trying to fix the (default HACS) Hildebrand DCC Integration… many folks are creating forks, but the original is abandoned - so I’m trying to resurect it …using a similar strategy to the original coder, and using the same HildebrandeGLow API.
I have the Gas and Electric usage sensors working (including using the correct API calls this time, and a modern Data Coordinator class…but I digress). These sensors reset each evening - and indeed show on the Enrergy dashboard correctly - and concur with the Bright app (which is released by the API developers as an app).
So everything is as it should be I think, except…
My problem is the Cost sensors - while these are returned by the API as (increasing) total cost per day (so, as per useage, they reset at 12 am…well, 1am usually) and positive values (in GBP) that aligns with the API, HA Energy dashboard shows some ‘random’ negative value in GBP. Its not a negative value of the original sensor cost value.
The Cost sensors include the tarrif rate applied and daily charge - so never reset to zero (only to the daily charge). I have simply used this sensor as a the ‘Use an entity tracking the total costs’. I have no other helpers etc.
Is it as simple as understanding the specifics between ‘Use and entity tracking total costs’ vs ‘Use an entity with current price’ ?
Can someone explain how it works, or point me to it ?


 What’s the best place to go & read about these things? BTW, I have set the sensor to