I hit a temporary issue with my gas energy consumption sensor last month, and I’m trying to remove it from my consumption history.
I’ve removed it a few times, but it continues to come back somehow after the current hour ends, pushing the latest hour up by the value I subtracted (~376kw).
I’ve done this by subtracting 376 from the sum for all of the statistics and state tables I could find for that metadata_id. (states, statistics, statistics_short_term).
At this point, restoring from a backup would do more damage, as I want to keep the last few weeks of data in general.
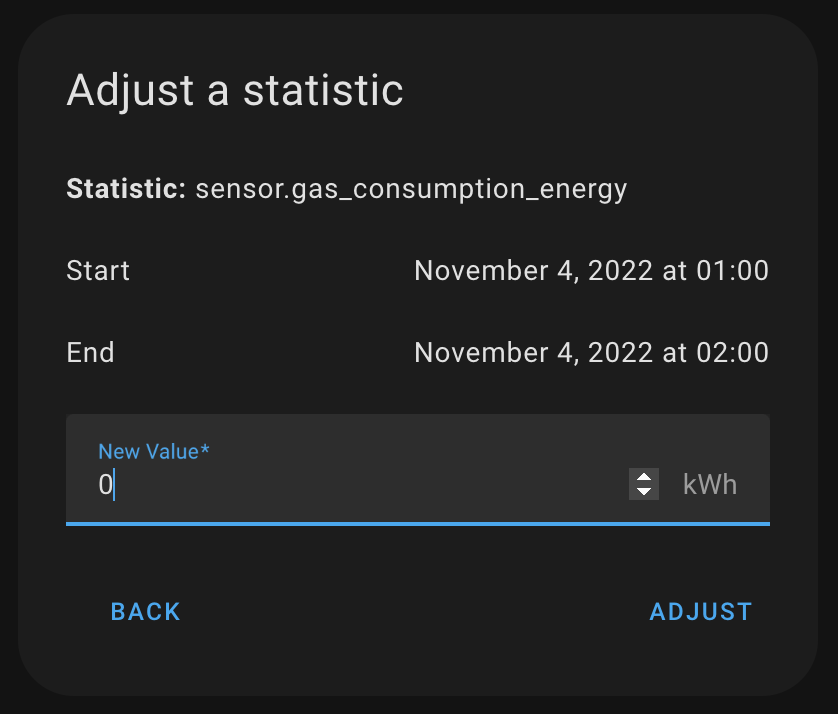
Go to Developer Tools, select the Statistics tab and locate your entity there. On the right you will find an icon described as “Adjust sum”.
Use it to find the hour/date of the peak and adjust the value there (or set it to 0).
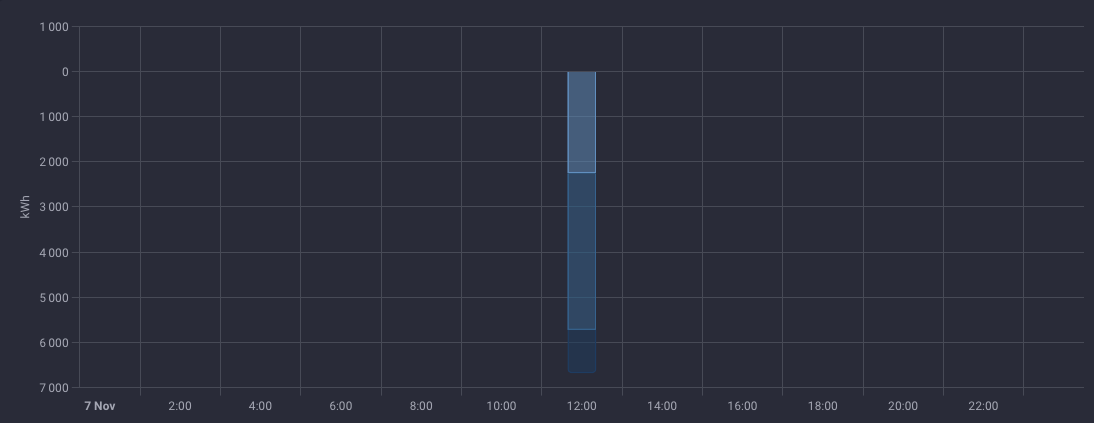
I tried this method but for some reason it does not work. So, I just messed up playing with PowerCalc sensors and I created artificial HUUUGE value for returning energy to the grid. Here is how it looks.
Normal day:
As you can see the failure occured some time around the noon. Now, when I go to Dev Tools, energy entities and I select specific date and time, everything seems to look OK. Here is sample for one 10 minutes interval, but all looks similar for 12 hour:
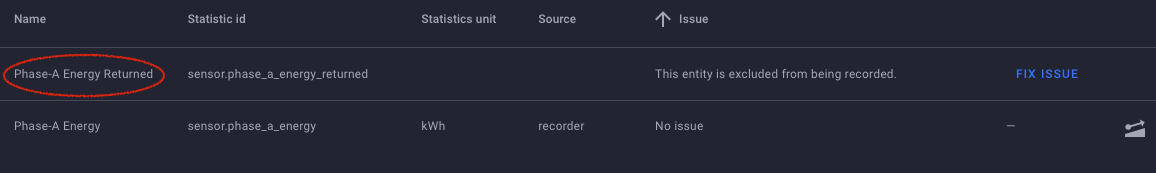
I did not noticed this one previosly… was it created automatically for Shelly 3EM or was created by HA when negative consuption happened? The problem is that it cannot be fixed, as it is not being recorded
So how can I get rid of this messed up 1 hour data? Any hint?
Have you played around with the “Adjust a statistic” date and time picker?
I believe I set the minutes to “00” to see the right list underneath for my particular issue. The UI there seems a bit broken or poor UX.
Yes, I did… Do not what happened (perhaps it was required to wait until end of the month to create appropriate summary entry), but finally it showed on statistics and I could fix this. Issue is, however, that now I see corrected daily, weekly and monthly consumtion, but not hourly (for corrected time it shows 0, while I put reasonable while fixing issue) and not for idividual devices. So summary shows ‘proper’ positive data, but devices’ graph is still screewed, showing negative consuption. For ~70 monitored devices I’m not gonna fix it, not worth effort. Anyhow I’m considering DB migration, I might loose my entire histry and start from scratch.
Oh I also saw a negative for the current hour back when I applied this fix. I just set it to 0 to solve, as I luckily hadn’t had my gas running then. This was only on one device/statistic though, I wouldn’t fancy doing that for 70