Hi HA Community,
I’m creating this post as a last resort, we have run out of options. Sorry if it is long; I wanted to foresee as many questions as possible to avoid possible back and forth!
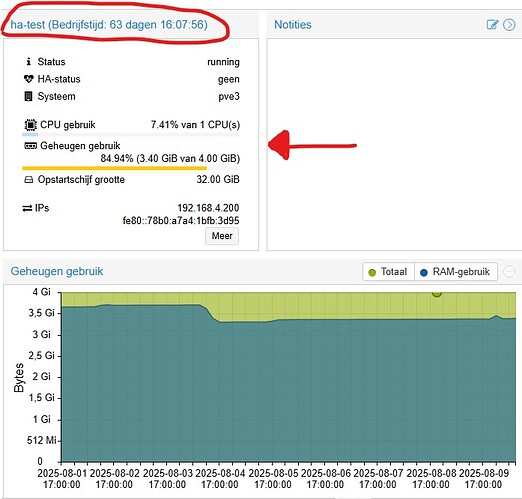
Essentially, we have been experiencing consistently high (80% out of 8GB) RAM usage on our HA instance running as a VM on Proxmox. The issue has persisted for several months (since May 2024, it seems), and we are running out of ideas.
HA:
Proxmox server as a whole:
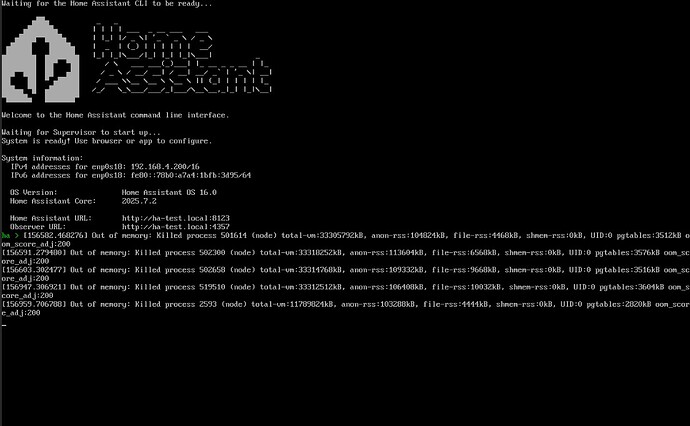
The current database (home-assistant_v2.db) is currently at ~1.7 GB. The system remains functional until OOM errors occur. We get OOM on the proxmox console (not always) and what seems like a soft reboot (get a HA is starting, but not everything is ready…).
Hopefully, someone can steer us on the right path. We’ve been monitoring memory usage using both Home Assistant’s System Monitor integration and System>Hardware. Both report the same. Memory usage starts at ~80% immediately after booting. CPU utilisation remains low (~7% usually).
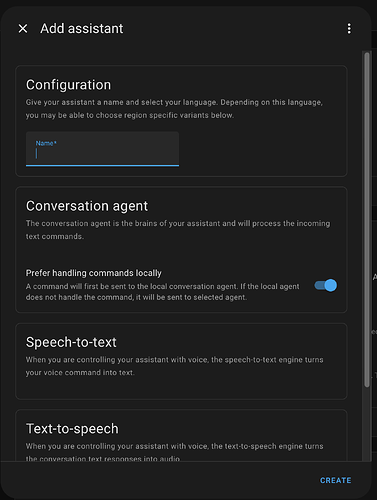
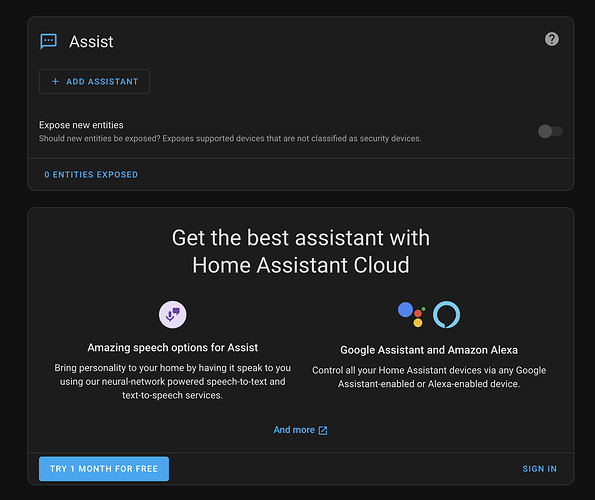
One thing that I found always triggers an OOM is going into the “voice assistants” config menu. We are Nabu Casa subscribers but there visit shows no assist set up, despite it being available to use.
And no new assist can be set up. There are no options. (note: we ARE using default_config: on configuration.yaml)
After clicking add assistant, it runs OOM, and when it reloads, I get this for a good few minutes… it seems to forget we have Nabu Casa Cloud!
Even though it works! So there is one right there, and it responds fine to text, with TTS and STT.
The “Expose” menu simply does not load either…!
System Details
-
Host Machine:
- CPU: 8 x Intel(R) Core™ i7-4770 CPU @ 3.40GHz
- RAM: 32 GB
- Storage: SSD with 10 GB free (allocated 60 GB to the VM, including space for local backups)
-
VM Configuration:
- Assigned RAM: 8 GB
- Assigned CPUs: 4 cores
-
Home Assistant Installation:
- Type: Home Assistant OS (VM)
- Core Version:
2025.1.1(updated to 2025.1.2, but the issue remained. Reverted a backup since we were doing extensive testing. More on that later) - Supervisor Version:
2024.12.3 - Operating System Version:
14.1 - Frontend Version:
20250106.0
Add-ons and Integrations
Add-ons Installed:
File editor (5.8.0),
Duck DNS (1.18.0),
Terminal & SSH (9.16.0),
ESPHome Device Builder (2024.12.2),
Mosquitto broker (6.4.1),
Node-RED (19.0.0),
Home Assistant Google Drive Backup (0.112.1),
AppDaemon (0.16.7),
Studio Code Server (5.18.0),
WireGuard (0.10.2),
AirCast (4.2.3),
openWakeWord (1.10.0),
Zigbee2MQTT (2.0.0-2),
Samba share (12.3.2),
Tailscale (0.24.0),
Everything Presence Zone Configurator (1.1.1),
Whisper (2.4.0),
Piper (1.5.2),
Glances (0.21.1)
Integrations Enabled:
* adaptive_lighting
* alexa_media
* bluetooth
* cloud
* dlna_dms
* ecovacs
* esphome
* flux_led
* google_assistant_sdk
* google_home
* group
* homekit
* homekit_controller
* iss
* lifx
* localtuya
* min_max
* mobile_app
* moon
* mqtt
* powercalc
* scheduler
* shopping_list
* sun
* systemmonitor
* template
* thermal_comfort
* tplink_router
* tuya
* utility_meter
* xiaomi_ble
* zha
* anniversaries
* ble_monitor
* blitzortung
* bthome
* co2signal
* dnsip
* foldingathomecontrol
* fully_kiosk
* generic_hygrostat
* generic_thermostat
* go2rtc
* hacs
* hildebrandglow_dcc
* hyperion
* ibeacon
* octoprint
* octopus_energy
* openplantbook
* oralb
* private_ble_device
* samsung_soundbar
* smartlife
* switchbot
* wyoming
* group
* min_max
* template
* utility_meter
* hassio
* scheduler
* plant
Troubleshooting Steps
-
Booted into Safe Mode to discard custom integrations and frontend stuff.
-
Disabled remaining Integrations one by one. Rebooted the whole VM (unsure whether it is necessary, but just in case a regular reboot would not clear the RAM of the integrations)
-
Checked Add-on Resource Usage, but none of the add-ons exceed ~1% RAM.
-
- No runtime errors using ha debug mode.
- Ran profiler; can provide the logs
-
Tested with Lower RAM Allocation (4 GB). HA booted but the VM became unresponsive with immediate OOM errors.
Let me know if there is anything else I can provide or do. Any help is welcome!
Thank you so so much to the whole community and developers!!!
UPDATES:
- 2025/01/19
We have created a new VM from scratch, and restored up HA core ONLY from a backup. The memory issue persisted. We then started shelling out the HA by:
- Removing every integration
- Removing every helper
- Wiping out yaml sensors, templates and integrations
- Purging the recorder database completely
→ RAM did not budge, still at over 5 GB.
For comparison, the same VM config, in the same hardware, with a fresh HA install (set-up) used 0.6 GB of RAM only.


