You could import the data into for instance influxdb or migrate the home assistant db to MariaDB, have a look here https://www.home-assistant.io/components/recorder/ . If you use MariaDB instead as the Home Assistant recorder, I guess the HA graphs can be used directly. If you use influxdb,its easy to generate graphs with grafana, https://grafana.com/.
I use Appdaemon/HADashboard as an alternative frontend for Home Assistant and I have written a widget for HADashboard to display interactive graphs from both the Home Assistant recorder and from influxdb, see here, https://github.com/tjntomas/HADashboard-widgets
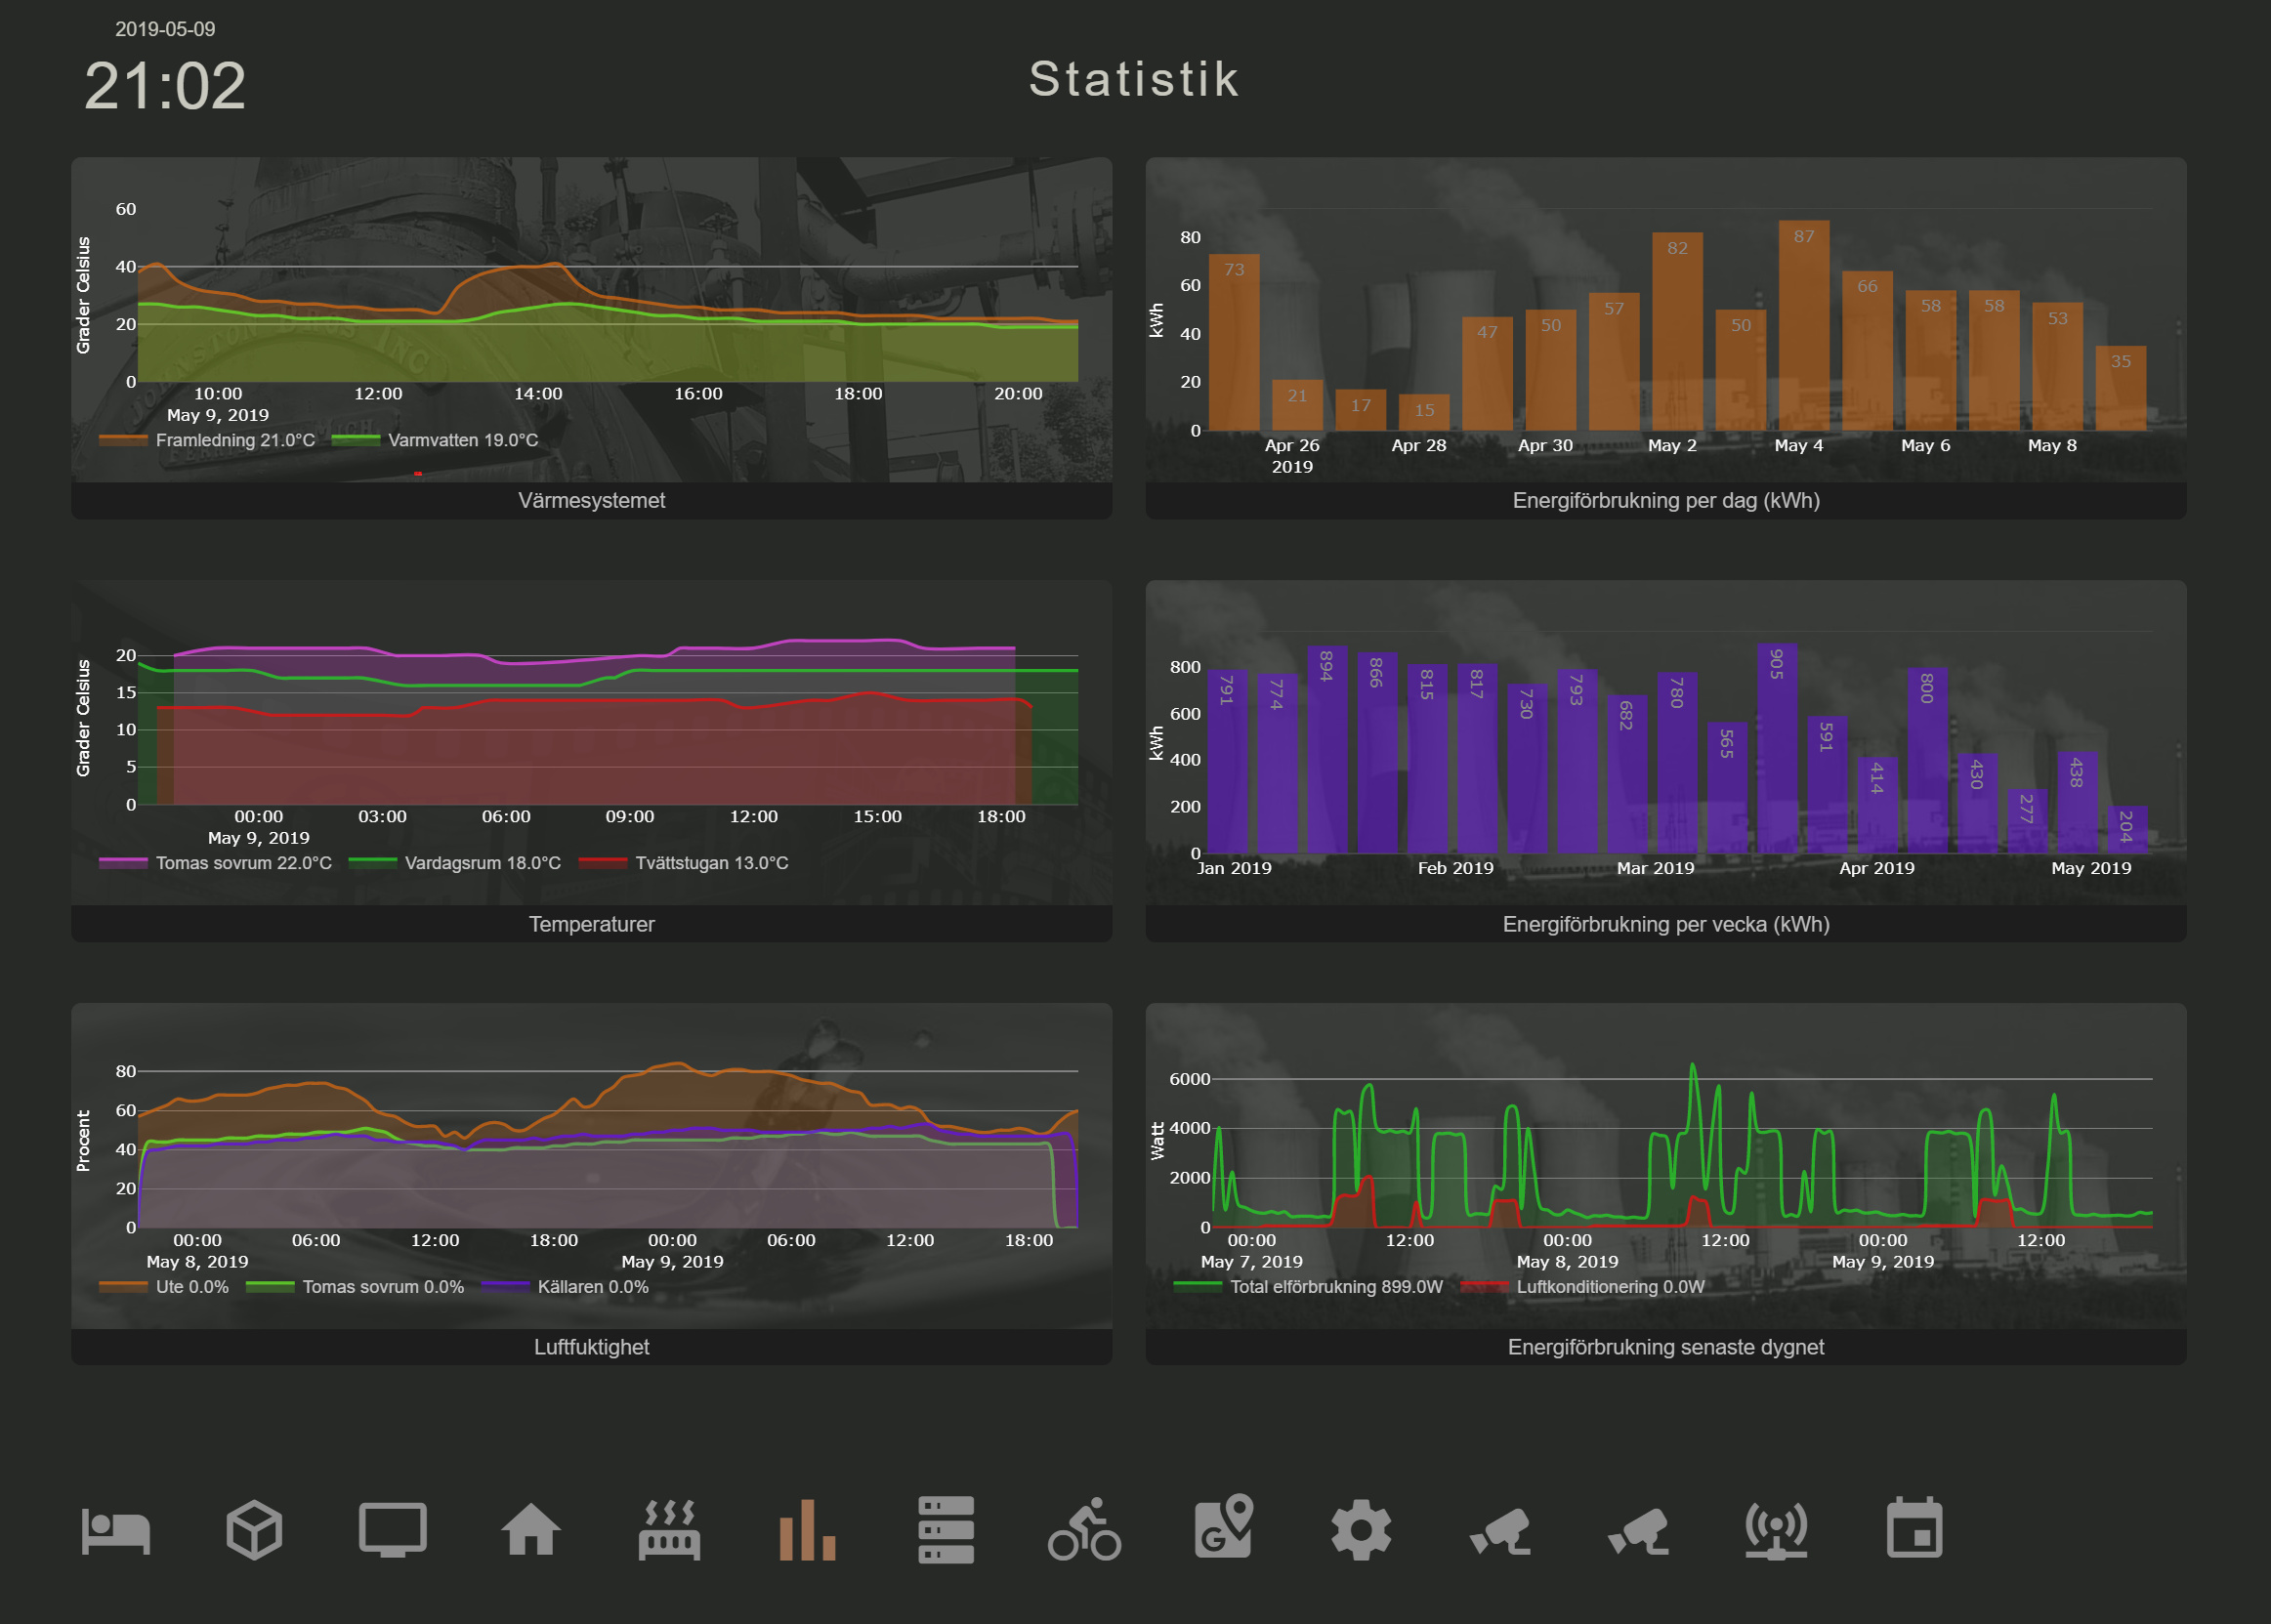
Looks like this:
Looks awesome!
I have a working setup with influxdb so that might be the easiest route. How do I import the json file to the home_assistant database? I have Chronograph installed and should be able to import data there(?). And there probably will be an issue with formatting?
Importing into influx is probably the easiest. If you are familiar with python, you can write a short script to import your data. I have a few of those. Can you post a part of the json file on https://hastebin.com/ and share a link here? I can’t help with Chronograph since I dont use it.
If it’s easy it would be great to import all to HA. If not, then the last part under “years” is the most important. That’s each month’s energy consumption.