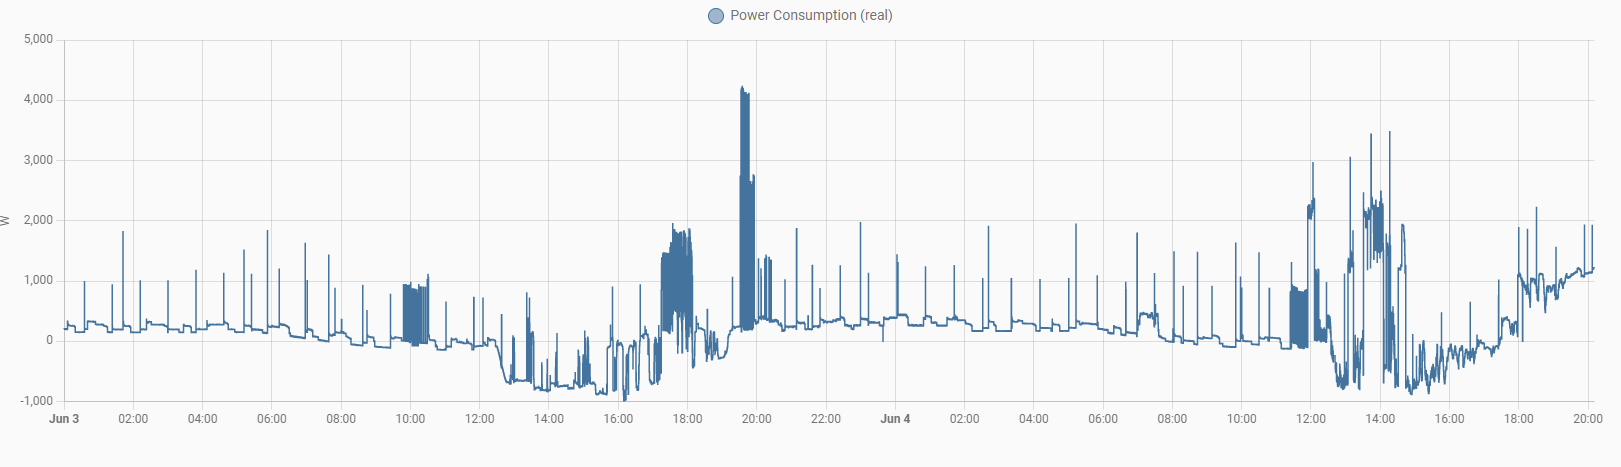
the problem came back… at approx 20:40
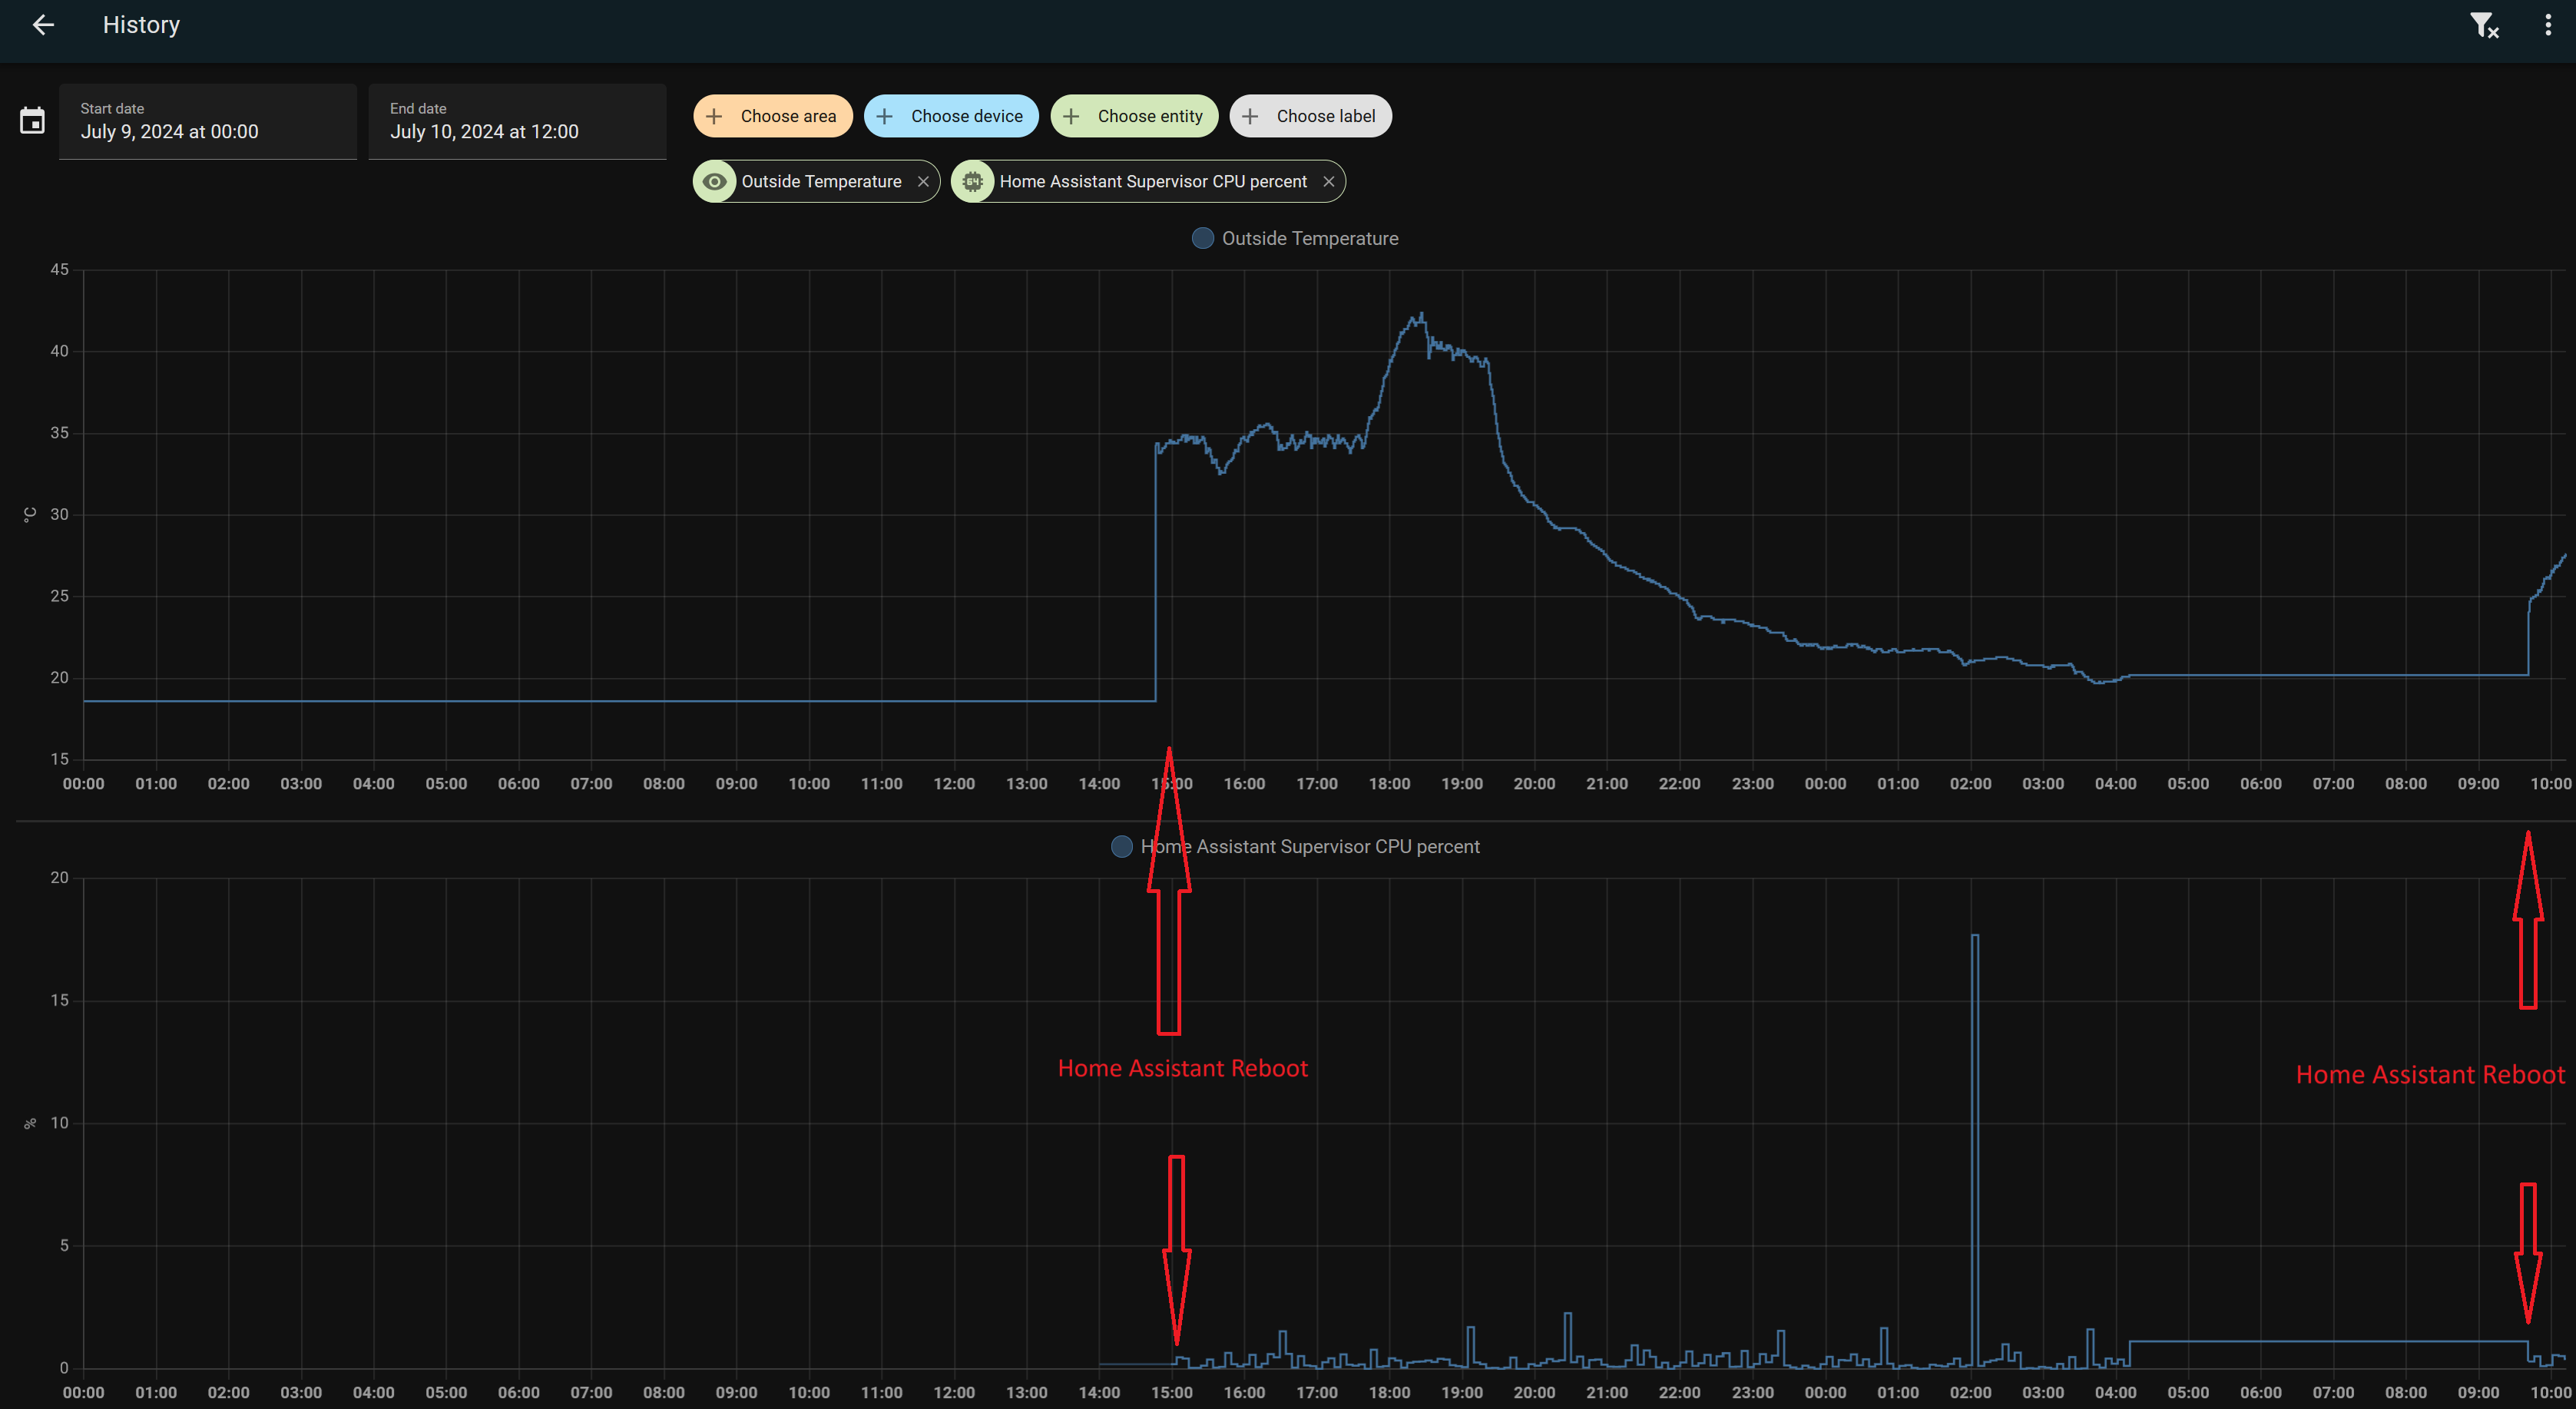
i have some Log Erros in home assist core log, but i assume they are whilst reboot…but they talk about to high cpu load…
Logger: homeassistant.components.websocket_api.http.connection
Source: components/websocket_api/http.py:186
Integration: Home Assistant WebSocket API (documentation, issues)
First occurred: 20:42:28 (1 occurrences)
Last logged: 20:42:28

[547967745376] HomeAdmin from 192.168.1.233 (Mozilla/5.0 (Windows NT 10.0; Win64; x64) AppleWebKit/537.36 (KHTML, like Gecko) Chrome/109.0.0.0 Safari/537.36): Client unable to keep up with pending messages. Stayed over 1024 for 5 seconds. The system's load is too high or an integration is misbehaving
Logger: homeassistant.helpers.frame
Source: helpers/frame.py:77
First occurred: June 4, 2023 at 20:34:41 (1 occurrences)
Last logged: June 4, 2023 at 20:34:41

Detected integration that called async_setup_platforms instead of awaiting async_forward_entry_setups; this will fail in version 2023.3. Please report issue to the custom integration author for hacs using this method at custom_components/hacs/__init__.py, line 171: hass.config_entries.async_setup_platforms(
Logger: homeassistant.setup
Source: runner.py:179
First occurred: 20:34:38 (2 occurrences)
Last logged: 20:34:38

Setup of input_boolean is taking over 10 seconds.
Setup of input_number is taking over 10 seconds.
Logger: homeassistant.components.sensor
Source: helpers/entity_platform.py:236
Integration: Sensor (documentation, issues)
First occurred: 20:34:26 (1 occurrences)
Last logged: 20:34:26

Platform influxdb not ready yet: Cannot connect to InfluxDB due to 'HTTPConnectionPool(host='192.168.1.10', port=8086): Max retries exceeded with url: /query?q=SHOW+DATABASES%3B (Caused by NewConnectionError('<urllib3.connection.HTTPConnection object at 0x7f91a3bb50>: Failed to establish a new connection: [Errno 111] Connection refused'))'. Please check that the provided connection details (host, port, etc.) are correct and that your InfluxDB server is running and accessible.; Retrying in background in 30 seconds
Logger: homeassistant.components.influxdb.sensor
Source: components/influxdb/sensor.py:167
Integration: InfluxDB (documentation, issues)
First occurred: 20:34:26 (1 occurrences)
Last logged: 20:34:26

Cannot connect to InfluxDB due to 'HTTPConnectionPool(host='192.168.1.10', port=8086): Max retries exceeded with url: /query?q=SHOW+DATABASES%3B (Caused by NewConnectionError('<urllib3.connection.HTTPConnection object at 0x7f91a3bb50>: Failed to establish a new connection: [Errno 111] Connection refused'))'. Please check that the provided connection details (host, port, etc.) are correct and that your InfluxDB server is running and accessible.
one message whilest booting time… so not a prob?
Logger: homeassistant.components.influxdb
Source: components/influxdb/__init__.py:488
Integration: InfluxDB (documentation, issues)
First occurred: 20:34:25 (1 occurrences)
Last logged: 20:34:25

Cannot connect to InfluxDB due to 'HTTPConnectionPool(host='192.168.1.10', port=8086): Max retries exceeded with url: /write?db=homeassistant (Caused by NewConnectionError('<urllib3.connection.HTTPConnection object at 0x7f91976fb0>: Failed to establish a new connection: [Errno 111] Connection refused'))'. Please check that the provided connection details (host, port, etc.) are correct and that your InfluxDB server is running and accessible. Retrying in 60 seconds.
influx log
nothing suspicious…
[20:34:00] INFO: Kapacitor is waiting until InfluxDB is available...
[20:34:00] INFO: Chronograf is waiting until InfluxDB is available...
[20:34:01] INFO: Starting the InfluxDB...
[20:34:36] INFO: Starting the Kapacitor
[20:34:36] INFO: Starting Chronograf...
'##:::'##::::'###::::'########:::::'###:::::'######::'####:'########::'#######::'########::
 ##::'##::::'## ##::: ##.... ##:::'## ##:::'##... ##:. ##::... ##..::'##.... ##: ##.... ##:
 ##:'##::::'##:. ##:: ##:::: ##::'##:. ##:: ##:::..::: ##::::: ##:::: ##:::: ##: ##:::: ##:
 #####::::'##:::. ##: ########::'##:::. ##: ##:::::::: ##::::: ##:::: ##:::: ##: ########::
 ##. ##::: #########: ##.....::: #########: ##:::::::: ##::::: ##:::: ##:::: ##: ##.. ##:::
 ##:. ##:: ##.... ##: ##:::::::: ##.... ##: ##::: ##:: ##::::: ##:::: ##:::: ##: ##::. ##::
 ##::. ##: ##:::: ##: ##:::::::: ##:::: ##:. ######::'####:::: ##::::. #######:: ##:::. ##:
..::::..::..:::::..::..:::::::::..:::::..:::......:::....:::::..::::::.......:::..:::::..::
2023/06/04 20:34:37 Using configuration at: /etc/kapacitor/kapacitor.conf
time="2023-06-04T20:34:51+02:00" level=info msg="Reporting usage stats" component=usage freq=24h reporting_addr="https://usage.influxdata.com" stats="os,arch,version,cluster_id,uptime"
time="2023-06-04T20:34:51+02:00" level=info msg="Serving chronograf at http://127.0.0.1:8889" component=server
[20:34:52] INFO: Starting NGINX...
Grafana log shows something strange:
what are these cleanup jobs every 10 Minutes?
[20:34:07] INFO: Starting NGINX...
logger=cleanup t=2023-06-04T20:44:07.489215399+02:00 level=info msg="Completed cleanup jobs" duration=35.760273ms
logger=cleanup t=2023-06-04T20:54:07.478318063+02:00 level=info msg="Completed cleanup jobs" duration=25.019067ms
logger=cleanup t=2023-06-04T21:04:07.477116818+02:00 level=info msg="Completed cleanup jobs" duration=24.056814ms
logger=cleanup t=2023-06-04T21:14:07.489102729+02:00 level=info msg="Completed cleanup jobs" duration=35.19953ms
logger=cleanup t=2023-06-04T21:24:07.477455368+02:00 level=info msg="Completed cleanup jobs" duration=24.192132ms
logger=infra.usagestats t=2023-06-04T21:33:54.34898561+02:00 level=info msg="Sent usage stats" duration=348.349753ms
logger=cleanup t=2023-06-04T21:34:07.477463983+02:00 level=info msg="Completed cleanup jobs" duration=24.230492ms
logger=cleanup t=2023-06-04T21:44:07.476908322+02:00 level=info msg="Completed cleanup jobs" duration=23.659509ms
logger=cleanup t=2023-06-04T21:54:07.476606348+02:00 level=info msg="Completed cleanup jobs" duration=23.423496ms
logger=cleanup t=2023-06-04T22:04:07.479937705+02:00 level=info msg="Completed cleanup jobs" duration=25.462915ms
logger=cleanup t=2023-06-04T22:14:07.47801981+02:00 level=info msg="Completed cleanup jobs" duration=24.386623ms
logger=cleanup t=2023-06-04T22:24:07.478458198+02:00 level=info msg="Completed cleanup jobs" duration=24.58706ms
logger=cleanup t=2023-06-04T22:34:07.477420155+02:00 level=info msg="Completed cleanup jobs" duration=23.463777ms
logger=cleanup t=2023-06-04T22:44:07.477111018+02:00 level=info msg="Completed cleanup jobs" duration=23.845513ms
logger=cleanup t=2023-06-04T22:54:07.477017885+02:00 level=info msg="Completed cleanup jobs" duration=23.756508ms
logger=cleanup t=2023-06-04T23:04:07.488555618+02:00 level=info msg="Completed cleanup jobs" duration=34.558037ms
logger=cleanup t=2023-06-04T23:14:07.478016701+02:00 level=info msg="Completed cleanup jobs" duration=24.010431ms
logger=cleanup t=2023-06-04T23:24:07.477749215+02:00 level=info msg="Completed cleanup jobs" duration=23.848722ms
logger=cleanup t=2023-06-04T23:34:07.477385192+02:00 level=info msg="Completed cleanup jobs" duration=23.645241ms
logger=cleanup t=2023-06-04T23:44:07.487810807+02:00 level=info msg="Completed cleanup jobs" duration=34.757416ms
logger=cleanup t=2023-06-04T23:54:07.477170247+02:00 level=info msg="Completed cleanup jobs" duration=24.046991ms
Mariadb log seems OK
phpmyadmin.pma__userconfig                         OK
phpmyadmin.pma__usergroups                         OK
phpmyadmin.pma__users                              OK
sys.sys_config                                     OK
[20:33:47] INFO: Ensuring internal database upgrades are performed
[20:33:47] INFO: Ensure databases exists
[20:33:48] INFO: Create database homeassistant
[20:33:48] INFO: Ensure users exists and are updated
[20:33:48] INFO: Update user hassio_mariadbuser
[20:33:48] INFO: Init/Update rights
[20:33:49] INFO: Granting all privileges to hassio_mariadbuser on homeassistant
[20:33:49] INFO: Successfully send service information to Home Assistant.
mosquito broker log
is this normal, that connections are closed and reconnected every 2 minutes?

File Editor log
is this normal, that fileeditor has that Info every couple of seconds, even when not used?