I’m very new on this page, so please apologies me, if I made mistake, and I posted my question on a wrong space.
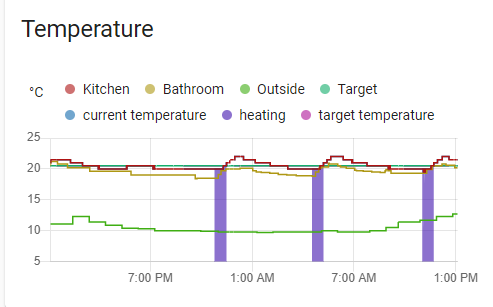
If I put my climate entity on a history graph then it show when it was heating or idle (filling with purple) like this:
I would like to have the same behavior with different sensors, but I don’t know how to do it? I need to configure the sensor different way or the history graph?
Thanks in advanced
I want to have as well dry/fan only/auto modes in the chart but there is no info how to do it. I see the API data request have these modes, only UI is not displaying in the chart and not listing in legends