Georg
June 2, 2019, 11:41am
1
Hello folks,
I want to enhance my graphs of temp, humidity and pressure. They should always show a specific range on Y-axis. E.g. Even if my pressure is sitting b/w 760 and 762 for a couple of days, I want to see the graph showing me the picture zoomed from 745 to 770. This way I can always understand what’s going on with a single glance instead of reading the graph and trying to figure out what is the zoom-level I have now.
I think I have an idea but want to check to prevent myself from reinventing a wheel.
It looks like that the card itself does not allow to do that → https://www.home-assistant.io/lovelace/history-graph/ . So I think I have to fake what I want with 2 sensors… Just create my own pair of them and set them to a fixed value I want:
- platform: mqtt
    name: 745
    state_topic: "zigbee2mqtt/sensor_temp_humid_pressure"
    icon: mdi:gauge
    unit_of_measurement: 'мм. рт. ст.'
    # instead of
    # value_template: '{{ (value_json.pressure | float / 1.33322) | round(1) }}'
    value_template: '{{ 745 }}'
Then add them to the graph.
tom_l
June 2, 2019, 12:50pm
2
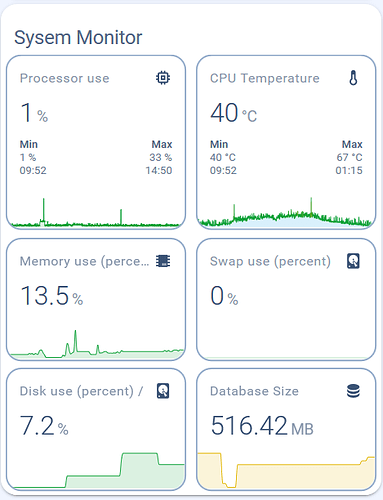
The custom mini-graph-card allows for setting the graph range (lower and upper bound), severity colour transitions and can display min / max on the graph as will as the current value:
3 Likes
Georg
June 2, 2019, 4:31pm
3
Thank you for the link, I’ll try it out. Based on the screenshots this sounds very promising and looks way much better than the built in card.
Hi @tom_l
where I can find the code for the example “Processor use” or “CPU Temperature” ?
They look very nice!
Thanks
tom_l
June 2, 2019, 11:52pm
5
This is the full card:
cards:
  - cards:
      - card:
          color_thresholds:
            - color: '#0da035'
              value: -1
            - color: '#e0b400'
              value: 25
            - color: '#e45e65'
              value: 35
          entities:
            - sensor.processor_use
          group: false
          hour24: true
          line_width: 2
          points_per_hour: 60
          show:
            extrema: true
            icon: true
            labels: false
            name: true
            state: true
          type: 'custom:mini-graph-card'
        style:
          border: solid 2px var(--primary-color)
          transform: scale(0.95)
        type: 'custom:card-modder'
      - card:
          color_thresholds:
            - color: '#039BE5'
              value: -50
            - color: '#0da035'
              value: 40
            - color: '#e0b400'
              value: 50
            - color: '#e45e65'
              value: 60
          entities:
            - sensor.cpu_temperature
          group: false
          hour24: true
          line_width: 2
          points_per_hour: 60
          show:
            extrema: true
            icon: true
            labels: false
            name: true
            state: true
          type: 'custom:mini-graph-card'
        style:
          border: solid 2px var(--primary-color)
          transform: scale(0.95)
        type: 'custom:card-modder'
    type: horizontal-stack
  - cards:
      - card:
          color_thresholds:
            - color: '#0da035'
              value: -1
            - color: '#e0b400'
              value: 60
            - color: '#e45e65'
              value: 70
          entities:
            - sensor.memory_use_percent
          group: false
          hour24: true
          line_width: 2
          points_per_hour: 6
          show:
            icon: true
            labels: false
            name: true
            state: true
          type: 'custom:mini-graph-card'
        style:
          border: solid 2px var(--primary-color)
          transform: scale(0.95)
        type: 'custom:card-modder'
      - card:
          color_thresholds:
            - color: '#0da035'
              value: -1
            - color: '#e0b400'
              value: 60
            - color: '#e45e65'
              value: 70
          entities:
            - sensor.swap_use_percent
          group: false
          hour24: true
          line_width: 2
          points_per_hour: 6
          show:
            icon: true
            labels: false
            name: true
            state: true
          type: 'custom:mini-graph-card'
        style:
          border: solid 2px var(--primary-color)
          transform: scale(0.95)
        type: 'custom:card-modder'
    type: horizontal-stack
  - cards:
      - card:
          color_thresholds:
            - color: '#0da035'
              value: -1
            - color: '#e0b400'
              value: 60
            - color: '#e45e65'
              value: 70
          entities:
            - sensor.disk_use_percent
          group: false
          hour24: true
          line_width: 2
          points_per_hour: 6
          show:
            icon: true
            labels: false
            name: true
            state: true
          type: 'custom:mini-graph-card'
        style:
          border: solid 2px var(--primary-color)
          transform: scale(0.95)
        type: 'custom:card-modder'
      - card:
          color_thresholds:
            - color: '#0da035'
              value: -1
            - color: '#e0b400'
              value: 500
            - color: '#e45e65'
              value: 1000
          entities:
            - sensor.database_size
          group: false
          hour24: true
          line_width: 2
          points_per_hour: 6
          show:
            icon: true
            labels: false
            name: true
            state: true
          type: 'custom:mini-graph-card'
        style:
          border: solid 2px var(--primary-color)
          transform: scale(0.95)
        type: 'custom:card-modder'
    type: horizontal-stack
title: Sysem Monitor
type: 'custom:vertical-stack-in-card'
2 Likes
Georg
June 3, 2019, 9:09am
6
I have definitely liked the card. At 1st I was missing the horizontal lines as on the History Graph card. Saw the reply in git about keeping the card as clean as possible. And ended up with that awesome coloring based on the values, that you have mentioned.
Thanks again.
ashscott
January 28, 2020, 11:06am
7
I’m trying to get this card to work, without success.
My raw config file contains:
resources:
  - type: module
    url: /www/community/mini-graph-card/mini-graph-card-bundle.js
and
    path: Energy
    title: Energy
  - badges: []
    cards:
      - card:
          color_thresholds:
            - color: '#0da035'
              value: -1
            - color: '#e0b400'
              value: 25
            - color: '#e45e65'
              value: 35
          entities:
            - sensor.oil_level_in_litres_2
          group: false
          hour24: true
          line_width: 2
          points_per_hour: 60
          show:
            extrema: true
            icon: true
            labels: false
            name: true
            state: true
          type: 'custom:mini-graph-card'
and my files are located here:
Any suggestions as to what may be going wrong?


