I updated the image a minute ago. Now the Add-on uses InfluxDB integration to get data from home assistant. The integration has an option to use the entity_id as metric name - this is great when using Grafana - just one click and you get the data you want.
With the influxdb integration homeassistant pushes every change directly to the database. This is an advantage because you get every change and not only the states every 20 seconds when scraping was used.
GitHub: HASSIO VictoriaMetrics Add-On
2 Likes
It seems the victoriametrics-prod file in the official docker image is different from the official arm64 image then. Need to investigate how to hash that now.
Use what image you want, no problem. It is just me trying to verify what I install 
An own thread for this add-on would be great!
I thought the official docker image would be a good choice. But i could change the binary to the one you recommended. I just wanted to avoid compile sessions and missed the binary downloads.
You meant these binary versions i think: Releases · VictoriaMetrics/VictoriaMetrics · GitHub
Here is the thread for the VictoriaMetrics Add-on:
2 Likes
After some research i am still at a loss and partly confused. Hopefully one of you can help.
I am running Home Assistant OS on a Raspberry pi 4, collecting data for almost a year with the current InfluxDB add-on V4.5.0. I finally wanted to set up a visualization with grafana, but got the same view and stumbled upon the same problems as Dingle:
So, as Dingle, I’m really keen to move to InfluxDB 2.x but haven’t figured out how to set this up with my Home Assistant OS environment and without losing the data I already collected in my InfluxDB V1.x database.
It seems there are (at least) two options to proceed for me:
Option 1: Continue using the community InfluxDB add-on and switch from api_version 1 to api_version 2
- As far as I understood, the InfluxDB add-on has the ability to run as InfluxDB 2.x installation. Key is the switch api_version which has to be set from 1 to 2 (and some other parameters). But I found no guidance to perform an upgrade/migration in case a InfluxDB 1.x installation is already been used.
- There is a guide for an automatic upgrade procedure available on the official influxdata documentation at https://docs.influxdata.com/influxdb/v2/install/upgrade/v1-to-v2/automatic-upgrade/. But is it at all sufficient or necessary for my environment?
- How do I keep my data when switching from InfluxDB 1.x to a InfluxDB 2.x installation?
Option 2: Go with InfluxDB2 add-on instead of community InfluxDB add-on
- There is another add-on made by jantoney with Are there plans for an influxdb v2 addon in the near future? · hassio-addons/addon-influxdb · Discussion #113 · GitHub and GitHub - Jays-Home-Assistant-Add-ons/j-addon-influxdb2: Scalable datastore for metrics, events, and real-time analytics.
- Jan himself stated that the reason for this new add-on was that, with regard to the community InfluxDB add-on, “The upgrade path from V1.x to V2.x requires access to the command line and isn’t a very user friendly process“. It almost looks as if jan’s addon would pick up my situation precisely…
- What I don’t get: Is the InfluxDB2 add-on a standalone add-on, means I can later remove the InfluxDB community add-on? Or does the InfluxDB2 add-on still require a running InfluxDB add-on and database?
- I’m pretty sure that I too would get this addon to work at some point. But of course I also ask myself how do I migrate the data of my current database to use with this addon?
Maybe someone has already gone through the same topic and can give me a few hints.
2 Likes
I’ve not looked at it myself yet, but I am going to investigate VictoriaMetrics as the Db to use for this sort of thing. VictoriaMetrics Add-on for long-term storage and data source for Grafana
Anyone figure out how to solve the InfluxDB add-on running out of memory?
runtime: out of memory: cannot allocate 8192-byte block (564428800 in use)
fatal error: out of memory
goroutine 1357 [running]:
runtime.throw(0xfebdde, 0xd)
        /usr/local/go/src/runtime/panic.go:774 +0x5c fp=0x47f9324 sp=0x47f9310 pc=0x41644
The memory in use, assuming 564363264 is in bytes not blocks, is only 0.525GB.
I’ve increased swap to 6GB, so I have over 5GB of swap available but it still fails allocating at that point.
Is the add-on limiting the amount of memory available to the container?
I tried changing the index from the default inmem to tsi1 by adding the following envvar to the add-on config. But I can’t tell whether it actually changed anything as Influx still dies on the same out of memory error.
- name: INFLUXDB_DATA_INDEX_VERSION
  value: tsi1
Great Addon - makes it much easier for rookies like myself 
Some questions though:
On the Admin board I just see the _internal DB. Is this the influx internal or the homeassistant internal (SQlite)?
Means: Do I need to create a DB manually and if so, where is this to be found (path)?
EDIT:
One more question:
Is the configuration in configuration.yaml still needed or is this hidden somewhere in the background by the Community AddOn?
EDIT II:
Sorry for my RTFM question.
I will check out the docs and might come back with reasonable questions.
This add-on will run influxdb on your Home Assistant OS. You could also run influxdb on another server machine somewhere. In that case you don’t need this add-on and can just install influxdb on the other server using influxdb’s own installation instructions.
In any case, you need to put the influxdb integration in configuration.yaml in order to send data from Home Assistant to influxdb.
The database should be created by influxdb itself (whether it is running in the add-on or on it’s own somewhere).
I have not used influxdb myself though so take this with a grain of salt.
Got it.
So basically, the add on does the (linux) installation, but the activation / configuration is up to the HA admin.
Thank you!
1 Like
Hi all,
Anyone know how i can enable RPC service in influxdb addon? i have HAOS with some addons, one of them is influxdb.
I’m trying making a remote database backup, but connection is refused because rpc port is closed.
Regards!
I am noticing my influx add on is in a continuous crash and restart cycle. Logs set to debug I see the entries below. Also, when in influx web ui I will routinely see pink popup saying influxdb is not running running.
I have attempted to change local host to the home assistant (linux VM on UNRAID) IP address to no avail.

s6-rc: info: service s6rc-oneshot-runner: starting
s6-rc: info: service s6rc-oneshot-runner successfully started
s6-rc: info: service fix-attrs: starting
s6-rc: info: service fix-attrs successfully started
s6-rc: info: service legacy-cont-init: starting
cont-init: info: running /etc/cont-init.d/00-banner.sh
-----------------------------------------------------------
 Add-on: InfluxDB
 Scalable datastore for metrics, events, and real-time analytics
-----------------------------------------------------------
 Add-on version: 4.5.0
 You are running the latest version of this add-on.
 System: Home Assistant OS 9.4  (amd64 / qemux86-64)
 Home Assistant Core: 2022.12.6
 Home Assistant Supervisor: 2022.11.2
-----------------------------------------------------------
 Please, share the above information when looking for help
 or support in, e.g., GitHub, forums or the Discord chat.
-----------------------------------------------------------
cont-init: info: /etc/cont-init.d/00-banner.sh exited 0
cont-init: info: running /etc/cont-init.d/01-log-level.sh
Log level is set to DEBUG
cont-init: info: /etc/cont-init.d/01-log-level.sh exited 0
cont-init: info: running /etc/cont-init.d/02-set-timezone.sh
[09:33:43] INFO: Configuring timezone
cont-init: info: /etc/cont-init.d/02-set-timezone.sh exited 0
cont-init: info: running /etc/cont-init.d/create-users.sh
cont-init: info: /etc/cont-init.d/create-users.sh exited 0
cont-init: info: running /etc/cont-init.d/influxdb.sh
cont-init: info: /etc/cont-init.d/influxdb.sh exited 0
cont-init: info: running /etc/cont-init.d/kapacitor.sh
cont-init: info: /etc/cont-init.d/kapacitor.sh exited 0
cont-init: info: running /etc/cont-init.d/nginx.sh
[09:33:43] DEBUG: Requested API resource: http://supervisor/dns/info
[09:33:43] DEBUG: Request method: GET
[09:33:43] DEBUG: Request data: {}
[09:33:43] DEBUG: API HTTP Response code: 200
[09:33:43] DEBUG: API Response: {"result": "ok", "data": {"version": "2022.04.1", "version_latest": "2022.04.1", "update_available": false, "host": "172.30.32.3", "servers": [], "locals": ["dns://192.168.1.1"], "mdns": true, "llmnr": true, "fallback": true}}
cont-init: info: /etc/cont-init.d/nginx.sh exited 0
s6-rc: info: service legacy-cont-init successfully started
s6-rc: info: service legacy-services: starting
services-up: info: copying legacy longrun chronograf (no readiness notification)
services-up: info: copying legacy longrun influxdb (no readiness notification)
services-up: info: copying legacy longrun kapacitor (no readiness notification)
services-up: info: copying legacy longrun nginx (no readiness notification)
s6-rc: info: service legacy-services successfully started
[09:33:43] INFO: Kapacitor is waiting until InfluxDB is available...
[09:33:43] INFO: Chronograf is waiting until InfluxDB is available...
[09:33:43] INFO: Starting the InfluxDB...
[09:33:59] INFO: Starting Chronograf...
[09:33:59] INFO: Starting the Kapacitor
'##:::'##::::'###::::'########:::::'###:::::'######::'####:'########::'#######::'########::
 ##::'##::::'## ##::: ##.... ##:::'## ##:::'##... ##:. ##::... ##..::'##.... ##: ##.... ##:
 ##:'##::::'##:. ##:: ##:::: ##::'##:. ##:: ##:::..::: ##::::: ##:::: ##:::: ##: ##:::: ##:
 #####::::'##:::. ##: ########::'##:::. ##: ##:::::::: ##::::: ##:::: ##:::: ##: ########::
 ##. ##::: #########: ##.....::: #########: ##:::::::: ##::::: ##:::: ##:::: ##: ##.. ##:::
 ##:. ##:: ##.... ##: ##:::::::: ##.... ##: ##::: ##:: ##::::: ##:::: ##:::: ##: ##::. ##::
 ##::. ##: ##:::: ##: ##:::::::: ##:::: ##:. ######::'####:::: ##::::. #######:: ##:::. ##:
..::::..::..:::::..::..:::::::::..:::::..:::......:::....:::::..::::::.......:::..:::::..::
2022/12/16 09:33:59 Using configuration at: /etc/kapacitor/kapacitor.conf
[09:34:09] INFO: InfluxDB stopped, restarting...
[09:34:10] INFO: Starting the InfluxDB...
time="2022-12-16T09:34:14-05:00" level=info msg="Reporting usage stats" component=usage freq=24h reporting_addr="https://usage.influxdata.com" stats="os,arch,version,cluster_id,uptime"
time="2022-12-16T09:34:14-05:00" level=info msg="Serving chronograf at http://127.0.0.1:8889" component=server
[09:34:14] INFO: Starting NGINX...
time="2022-12-16T09:34:20-05:00" level=debug msg=Request component=server method=GET remote_addr="127.0.0.1:54572" url=/api/hassio_ingress/jr3n9Y43gGgPb3XEnsM7_35wVwPT9RBZoPOnc52dBhc/chronograf/v1/me
time="2022-12-16T09:34:20-05:00" level=info msg="Response: OK" component=server method=GET remote_addr="127.0.0.1:54572" response_time="408.489µs" status=200
time="2022-12-16T09:34:31-05:00" level=debug msg=Request component=server method=GET remote_addr="127.0.0.1:43836" url=/api/hassio_ingress/jr3n9Y43gGgPb3XEnsM7_35wVwPT9RBZoPOnc52dBhc/chronograf/v1/me
time="2022-12-16T09:34:31-05:00" level=info msg="Response: OK" component=server method=GET remote_addr="127.0.0.1:43836" response_time=1.850602ms status=200
[09:34:35] INFO: InfluxDB stopped, restarting...
[09:34:35] INFO: Starting the InfluxDB...
time="2022-12-16T09:34:42-05:00" level=debug msg=Request component=server method=GET remote_addr="127.0.0.1:44554" url=/api/hassio_ingress/jr3n9Y43gGgPb3XEnsM7_35wVwPT9RBZoPOnc52dBhc/chronograf/v1/me
time="2022-12-16T09:34:42-05:00" level=info msg="Response: OK" component=server method=GET remote_addr="127.0.0.1:44554" response_time=2.820991ms status=200
time="2022-12-16T09:34:53-05:00" level=debug msg=Request component=server method=GET remote_addr="127.0.0.1:49644" url=/api/hassio_ingress/jr3n9Y43gGgPb3XEnsM7_35wVwPT9RBZoPOnc52dBhc/chronograf/v1/me
time="2022-12-16T09:34:53-05:00" level=info msg="Response: OK" component=server method=GET remote_addr="127.0.0.1:49644" response_time="502.598µs" status=200
[09:34:57] INFO: InfluxDB stopped, restarting...
[09:34:57] INFO: Starting the InfluxDB...
ts=2022-12-16T09:34:59.454-05:00 lvl=error msg="failed to connect to InfluxDB, retrying..." service=influxdb cluster=default err="Get \"http://localhost:8086/ping\": dial tcp 127.0.0.1:8086: connect: connection refused"
ts=2022-12-16T09:34:59.860-05:00 lvl=error msg="failed to connect to InfluxDB, retrying..." service=influxdb cluster=default err="Get \"http://localhost:8086/ping\": dial tcp 127.0.0.1:8086: connect: connection refused"
ts=2022-12-16T09:35:00.450-05:00 lvl=error msg="failed to connect to InfluxDB, retrying..." service=influxdb cluster=default err="Get \"http://localhost:8086/ping\": dial tcp 127.0.0.1:8086: connect: connection refused"
ts=2022-12-16T09:35:02.003-05:00 lvl=error msg="failed to connect to InfluxDB, retrying..." service=influxdb cluster=default err="Get \"http://localhost:8086/ping\": dial tcp 127.0.0.1:8086: connect: connection refused"
ts=2022-12-16T09:35:03.135-05:00 lvl=error msg="failed to connect to InfluxDB, retrying..." service=influxdb cluster=default err="Get \"http://localhost:8086/ping\": dial tcp 127.0.0.1:8086: connect: connection refused"
time="2022-12-16T09:35:04-05:00" level=debug msg=Request component=server method=GET remote_addr="127.0.0.1:38726" url=/api/hassio_ingress/jr3n9Y43gGgPb3XEnsM7_35wVwPT9RBZoPOnc52dBhc/chronograf/v1/me
time="2022-12-16T09:35:04-05:00" level=info msg="Response: OK" component=server method=GET remote_addr="127.0.0.1:38726" response_time=2.397502ms status=200
ts=2022-12-16T09:35:04.865-05:00 lvl=error msg="failed to connect to InfluxDB, retrying..." service=influxdb cluster=default err="Get \"http://localhost:8086/ping\": dial tcp 127.0.0.1:8086: connect: connection refused"
I’m having problems with database entries. After some time HA stops writing and the log shows this error
Logger: root
Source: components/influxdb/init.py:437
First occurred: 22:00:19 (1 occurrences)
Last logged: 22:00:19
Is there any rate limitating happening within the Influxdb addon?
I have a sensor sending an mqtt message every 5 seconds which I can see being received correctly in mqtt explorer and the HA mqtt integration. However when I use explore in influxdb I only see data shown in the database every 30 seconds. I have displayed this as a table so I can see this being updated in real time but this shows I am loosing 5 sensor values out of 6
Is this a limitation of influxdb on HA or am I missing something obvious?
newbie question. is there a way to send data to the Influx add-on database from outside of home assistant supervised system? I have unpoller setup on another device but can’t figure out the address on my lan of the influx db. is this even possible?
I guess if not i can move influx to the other host also, and then HA can send its data to that. that is a bit of a rebuild of graphana and my dashboards i was hoping to avoid. tia.
look at zerotier. if your remote sensor can install the zerotier package this maybe an option. HA supports zerotier and it is the easiest vpn solution i have ever used.
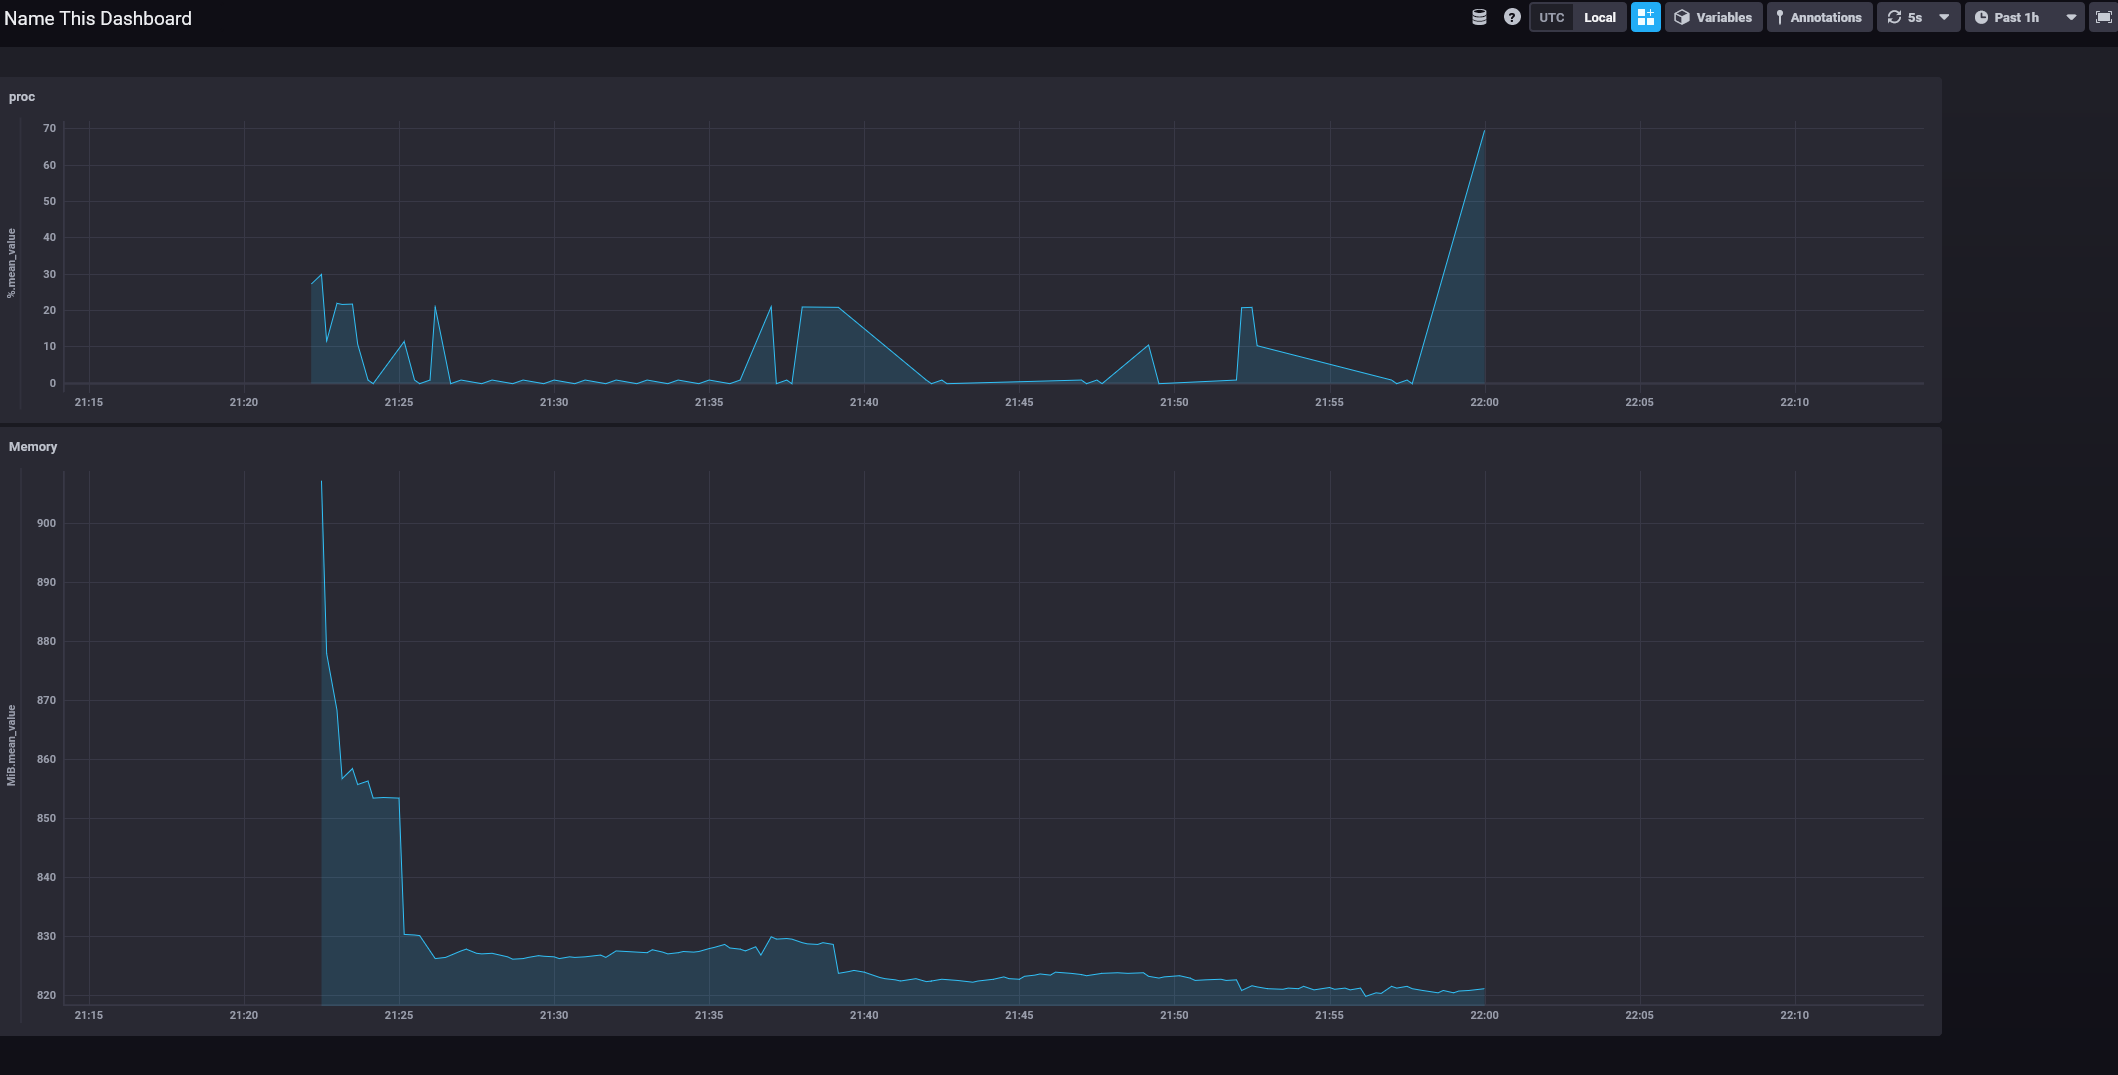
Can anyone help with high CPU usage for InfluxDB here? I posted an issue in the GitHub page (Sudden high CPU load · Issue #265 · hassio-addons/addon-influxdb · GitHub), but no one seems to be there.
In short, I suddenly see high CPU usage (~60 % on a RPi4) with InfluxDB. If I disable InfluxDB the CPU usage drops to 2-3 %.
I already tried some of the other posts about this (adding “store-enabled = false” to the config file etc.) to no avail.
Can someone point me in the right direction for debugging this?
Thanks.
Is the InfluxDB add-on, version 4.5.0, still maintained and supported? I’d rather stay away and not get hooked if it isn’t.

I am trying to get started on influxDB.
I have installed the add-on and can access the web-UI. However there is nothing there apart from the connection status.
Following this:
It says create a database:
“You will still need to create a database named home_assistant via InfluxDB’s command-line interface. For instructions on how to create a database check the InfluxDB documentation relevant to the version you have installed.”
That link doesn’t work however the documentation says to go to the influx CLI.
Can I no create a database from within HA?