Hi!
Maybe someone can help me. So far I had homebridge running on a Raspi. Out of curiosity I installed home assistant. Actually everything works quite well, except for one thing.
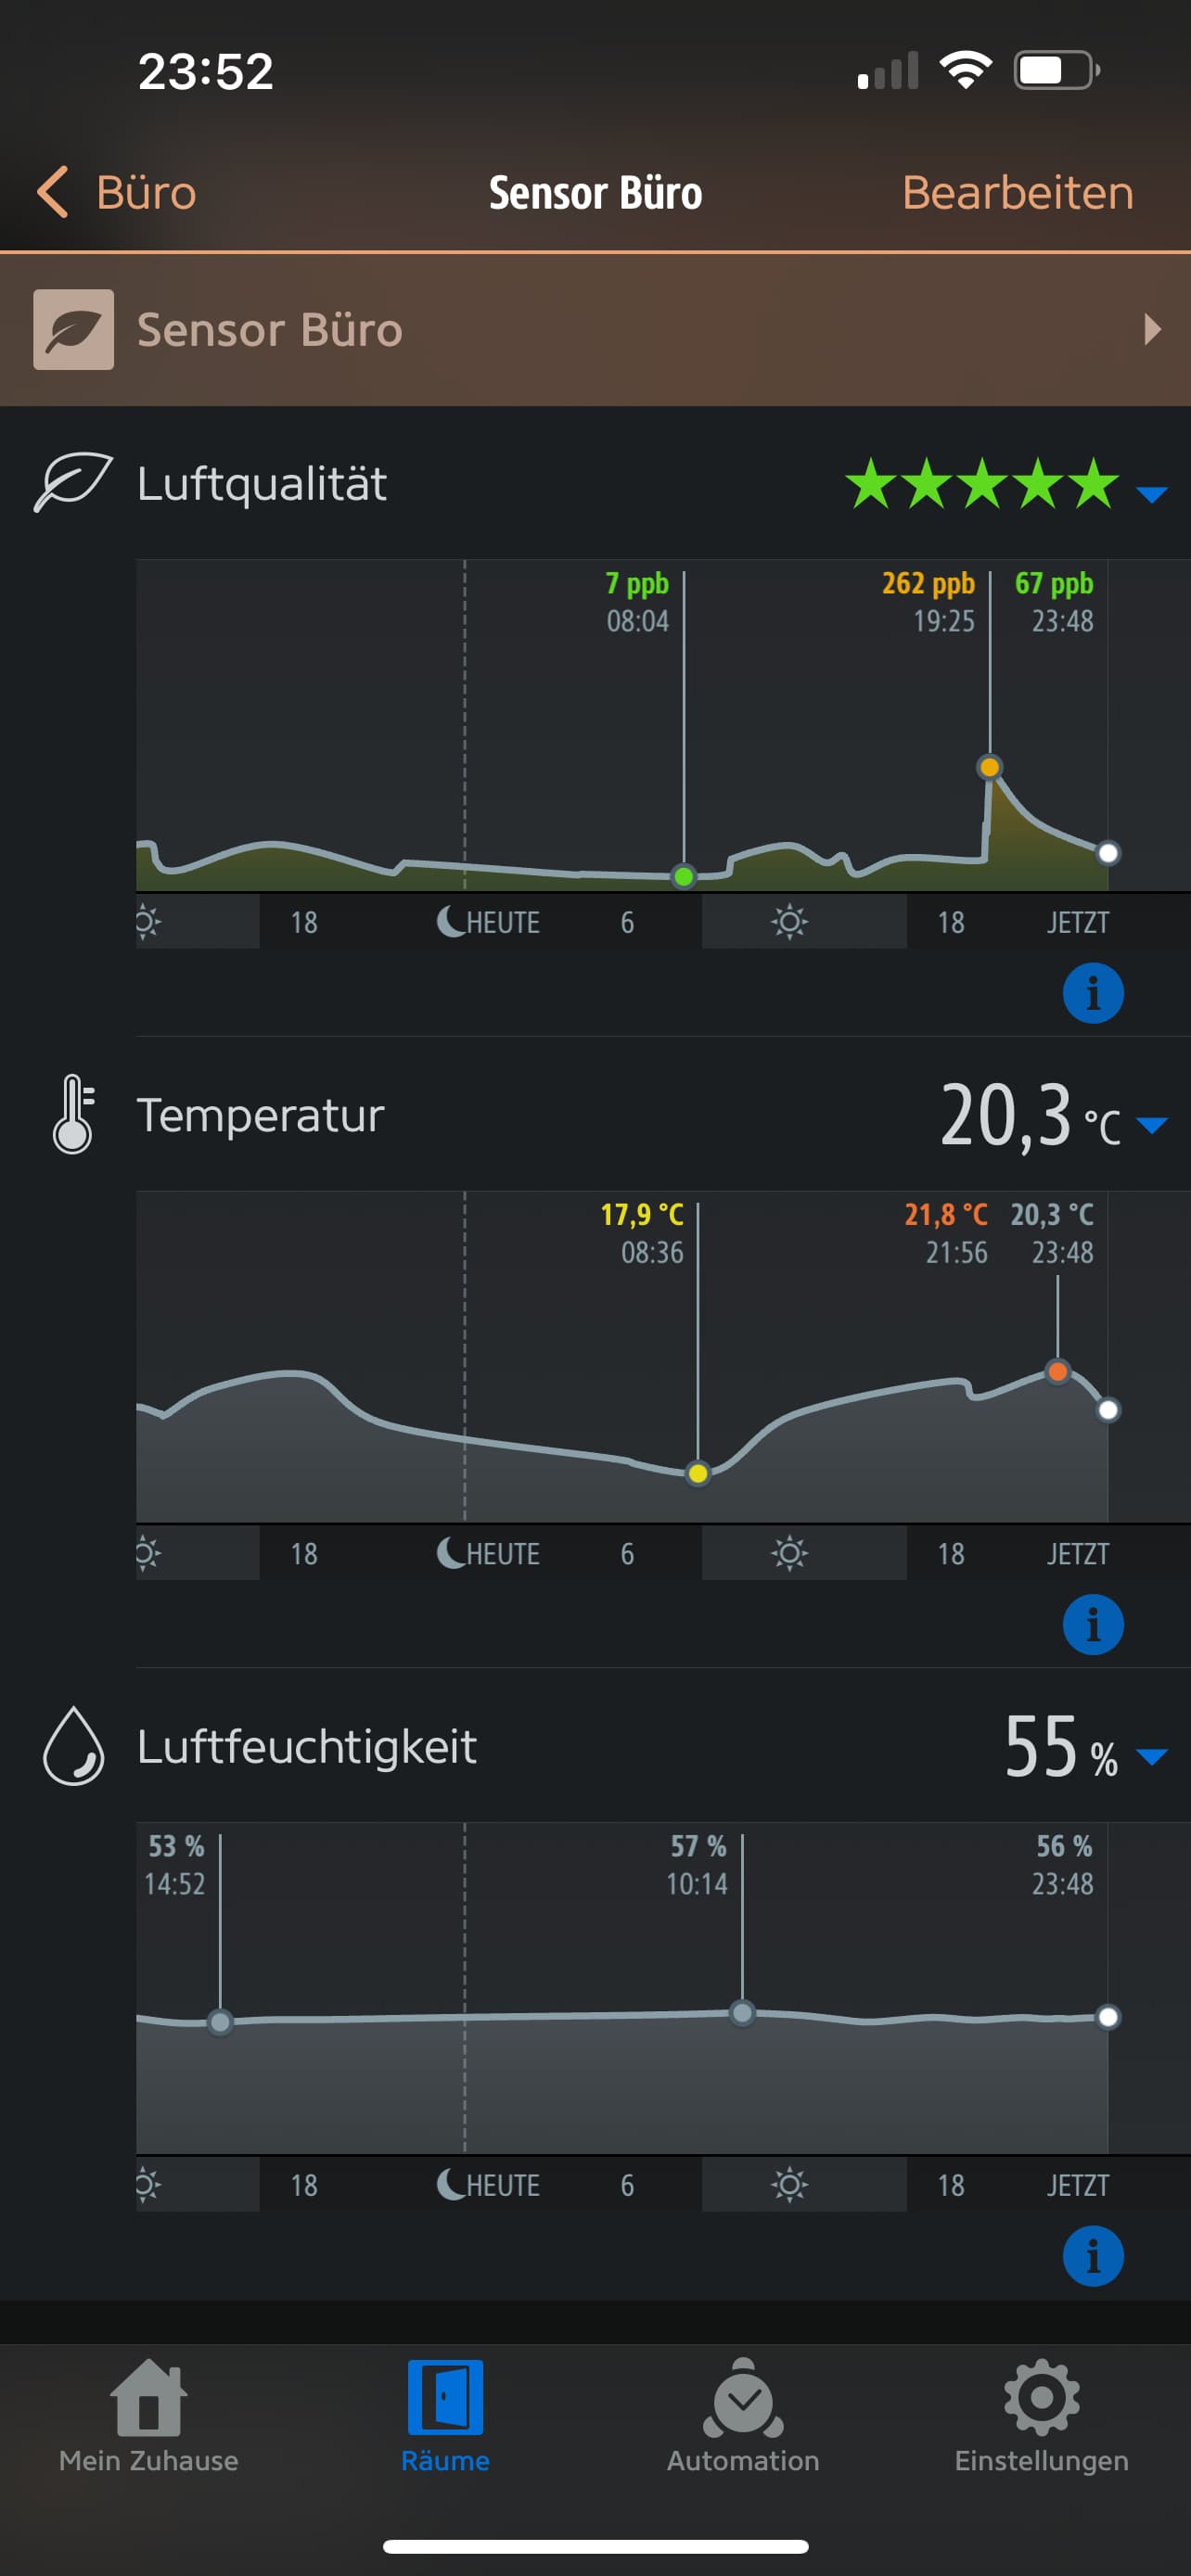
I use some Aqara sensors and bind them into homekit via Deconz/Conbee. With homebridge I could read the sensor data via the app Eve as a history graph/diagram. With home assistant this is no longer possible. Only the current sensor data is read out and displayed at Eve…
is there a solution?
Maybe this is the wrong forum category…