I use matplotlib together with AppDaemon to save plots in PNG format to be loaded in the frontend using the camera local file component.
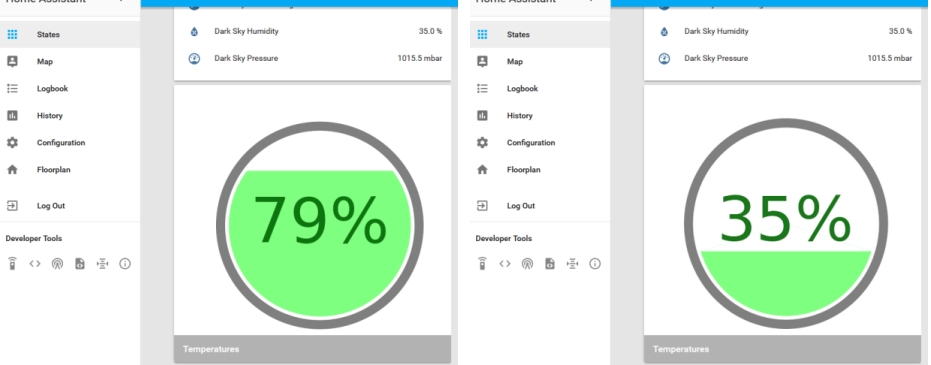
So far I had only created time series plots so I accepted the challenge to build one to easily visualize the state of a container (similar to the one on the bottom left corner that you posted). This is the result (since I’m not monitoring a container, I’m plotting the humidity from a sensor):
And this is the app that I code in AppDaemon:
import matplotlib
matplotlib.use('Agg')
import appdaemon.appapi as appapi
from matplotlib.patches import Wedge, Polygon
import matplotlib.pyplot as plt
import numpy as np
from datetime import datetime

class PlotWeather(appapi.AppDaemon):

  def initialize(self):
    self.log("Hello from plot_weather-app")
    start_time = datetime.now()
    # Plot every 12 hours
    self.run_every(self.make_plot, start_time, 12 * 60 * 60)

  def make_plot(self, kwargs):
    value = float(self.get_state("sensor.dark_sky_humidity"))
    mini, maxi = 0, 100 # update this with your range
    # min can be higher than max: mini, maxi = 140, 89.99
    vn = -1 + (value - mini) * 2 / (maxi - mini) # normalize value between -1 and 1
    theta = np.arcsin(vn) * 180 / np.pi
    color_water = [0,1,0,0.5] # [R,G,B,alpha] between 0 and 1
    color_text = [0,0.4,0,0.9]
    wedge = Wedge((0, 0), 1, 180-theta, theta,fc=color_water,lw=0) # this is a piece of pie (we'll add/substract a triangle later)
    fig, ax = plt.subplots(figsize=(5,5))
    ax.add_patch(wedge)
    if vn > 0:
      color_tri = color_water # the value is higher than 50%, we'll add a triangle with the same color
    else:
      color_tri = [1,1,1,1] # the value is lower than 50%, we have to hide (with white) a triangle shape of the piece of pie
    polygon = Polygon(([[0, 0],[np.cos(np.arcsin(vn)), vn],[-np.cos(np.arcsin(vn)), vn]]), closed= True,fc=color_tri,lw=0) # the triangle
    ax.add_patch(polygon)
    valueperc = str(int((value - mini) * 100 / (maxi - mini)))+'%' # the text to display
    ax.text(0, 0, valueperc, ha='center', va='center', fontsize=80, color=color_text)
    border = Wedge((0, 0), 1.14, 0, 360,width=0.1,fc=[0,0,0,0.5],lw=0) # the gray border
    ax.add_patch(border)
    ax.set_xlim([-1.2,1.2])
    ax.set_ylim([-1.2,1.2])
    ax.axis('off') # removing the axis
    fig.savefig('/mnt/mydisk/weather.png') # saving the figure. update the path
Maybe a lot of hassle to just show very little information but, hey! we are here for the fun 
I have to say that I haven’t tried Grafana so hopefully it is a lot easier to go that way.