To keep this as simple and concise as possible this request has these sections, with the below picture of part of my HA dashboard as reference:
- What the below picture means
- What I am looking to solve (in the red rectangles I have with “TBD” below in that picture). The question is actually in #2 and #3 - so I have made the actual questions bold italic underlined there.
- My current hardware and software setup that creates the below dashboard display (salient as it comes into play on what kind of solution to use)
and lastly to thank people for at least reading this -
- EYE CANDY! I put #4 at the bottom because it is a little long and not required to answer the question - but it is numerous links to pretty slick websites that are all driven by the information I send them (it is the least I can do for getting help from someone!)
- What the
belowabove picture means
I have a PWS (Personal Weather Station) which records and displays weather data - it is an AmbientWeather WS-2902C which does have a very robust integration with HA, which I am using to remind me to close specific windows that HA sees as left open when it starts raining, sets the lighting brightness level in certain parts of my home dependent upon an inverse relationship with the brightness outside (darker outside, brighter inside, etc.). However, I have done a little hacking to extended the functionality to distribute weather statistics data to weather web sites all over the world, as shown in the dashboard picture. Each of the above lines in the dashboard is the last time my weather data was successfully received by that web site, and the last part of each line in parenthesis is how often data is sent to that site (every “(5 min)” - you get the idea). Ocassionally there is an error in the transmission and the “Last weewx error:” shows the error message and time of any of those connections when an error is encountered in the data transmission (when a data transmission succeeds to whatever site had an error in the prevous attempt, the error message changes back to “No current errors”. The two in the red rectangles I cannot figure out how to monitor the data as received.
- What I am looking to solve (in the red rectangles I have with “TBD”
belowabove)
How can I capture some kind of validation that the data was received on the other end each time it is sent, to be able to put that statistic in the dashboard here instead of “TBD”?
In #3 “3. My current hardware and software setup that creates the below above dashboard display (salient as it comes into play on what kind of solution to use)” will explain what the “Cnsl>” that I prepend means).
FYI, the Wunderground (Weather Underground) web site (link I supply in #4 below and also here) below does have one place on the website which displays the latest update - and I could try to figure out how to do some screen scrap[ing but that seems lame) and keeps changing all over the place second to second (my station sends data there every 16 seconds but their website updates that text more often than that - they are also getting data from more than one place about my station - note the third entry in the dashboard as well - )

- My current hardware and software setup that creates the
belowabove dashboard display (salient as it comes into play on what kind of solution to use)
Hardware:
- Raspberry PI 4 w/8GB Ram running headless on local network via Ethernet CAT 6 (internet connection is 1GB up and down, fiber). (Running Raspbian, not Debian - kept the default by mistake, oops)
- Solar powered weather station mounted above the roof of my home transmits data via a weak radio signal (every 16 seconds) to an
- LED Console in my home that came with the weather station. The Console is connected to my home network via wifi, and also talks to the internet directly (*see B and C below).
Software:
The console (last bullet above) web based configuration software allows me to configure the console to send data to four places (and the console is on same lan segment as the RPI):
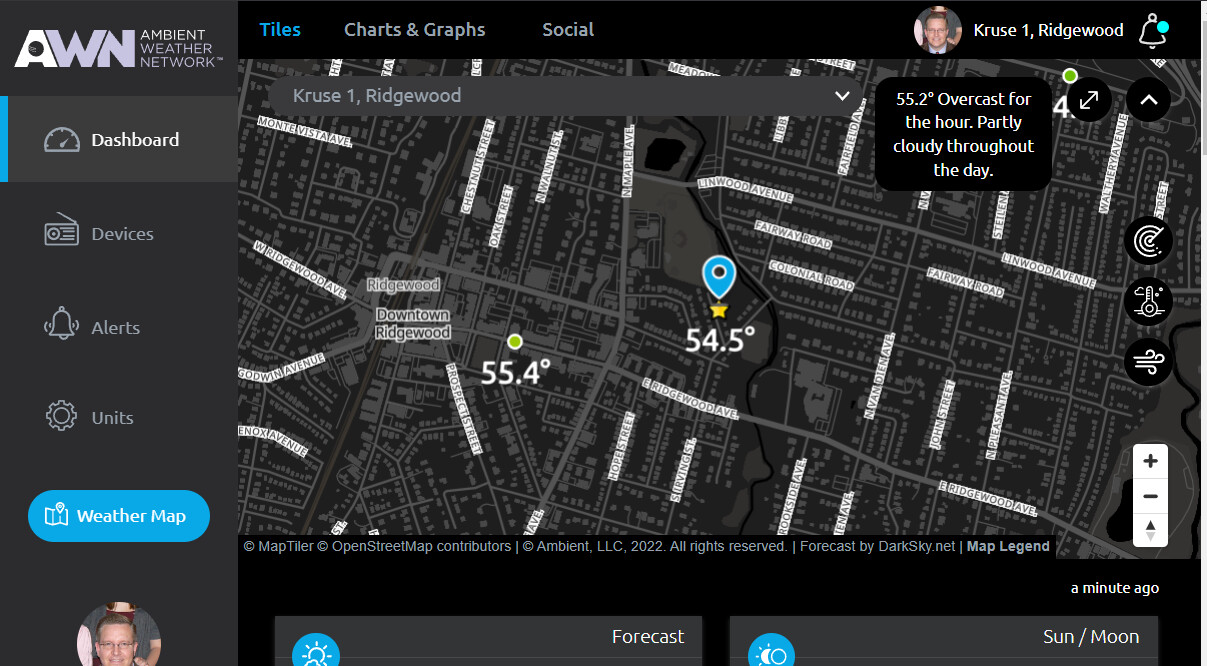
A. AmbientWeather.net (by default the manufacturer sends the data to their own website). I was able to figure out within the traffic I see on my network when it is sent to the manufacturer, so no “TBD” there 
B. Wunderground (hence the “Cnsl>” on the dashboard picture)*
C. Weathercloud (hence the “Cnsl>” on the dashboard picture)*
D. Customized - Here was my “In” to grab the data. On the RPI I have installed and configured an amazing piece of software (freeware linux) called weewx, which is extremely well written and includes built in a website for showing weather data, a database for same which is automatically populated, and numerous third-party plug-ins for capturing weather data in a huige variety of formats from almost any kind of hardware, as well as plugins to send the data to an unlimited number of places (one plugin per location however).
I was able to gather the information about the RESTful calls being successfully made from weex software running on the RPI host to the weather websites. I used command line sensors in HA on the same RPI to tail the log for each specific entry and gather that information. My templates for those command line sensors are ridiculously complicated (for date etc. formatting) especially the one with the logic to compare the most recent error message in the syslog to compare it to the time on all of the other sensors most recently verified transmission to determine whether or not to display the most recent transmission error or to instead show ‘no current errors’. At first I had to actually hack docker on the RPI to punch a hole in the softwar container to access the log directory on the host, but then later (yes log scraping is lame - not at all elegant) I was able to at least stop doing that by reconfiguring the OS to have both the weewx log and syslog files put into the /usr/share/hassio/share directory on the host that HA is able to see.
I have spoken with the manufacturer (AmbientWeather) and they verified both how often the data is sent to those two sites from the console (hence the “(16 Sec)” and “(10 Min)”, and also that the data is sent directly from the console to those sites (not via AmbientWeather being a middleman). During that same phone conversation the fellow at AmbientWeather did not know how I would be able to capture that traffic to analyze it. They also said that the wunderground wanted the data as often as possible and the timing is 16 seconds because because that is how often the solar powered PWS above the roof talks to the console.
So - what software/hardware combination would I need (willing to pay $$ and don’t care how complicated it is to do the programming) - to be able to monitor the newtork traffic to be able to capture, massage the format of, and then show the status of those other transmissions going straight from the console to those other web sites?
- EYE CANDY!
Not required for answering the question, but as a somewhat lame thank you to whoever is reading this, if you are curious here are the weather websites showing said data from my PWS (Personal Weather Station):
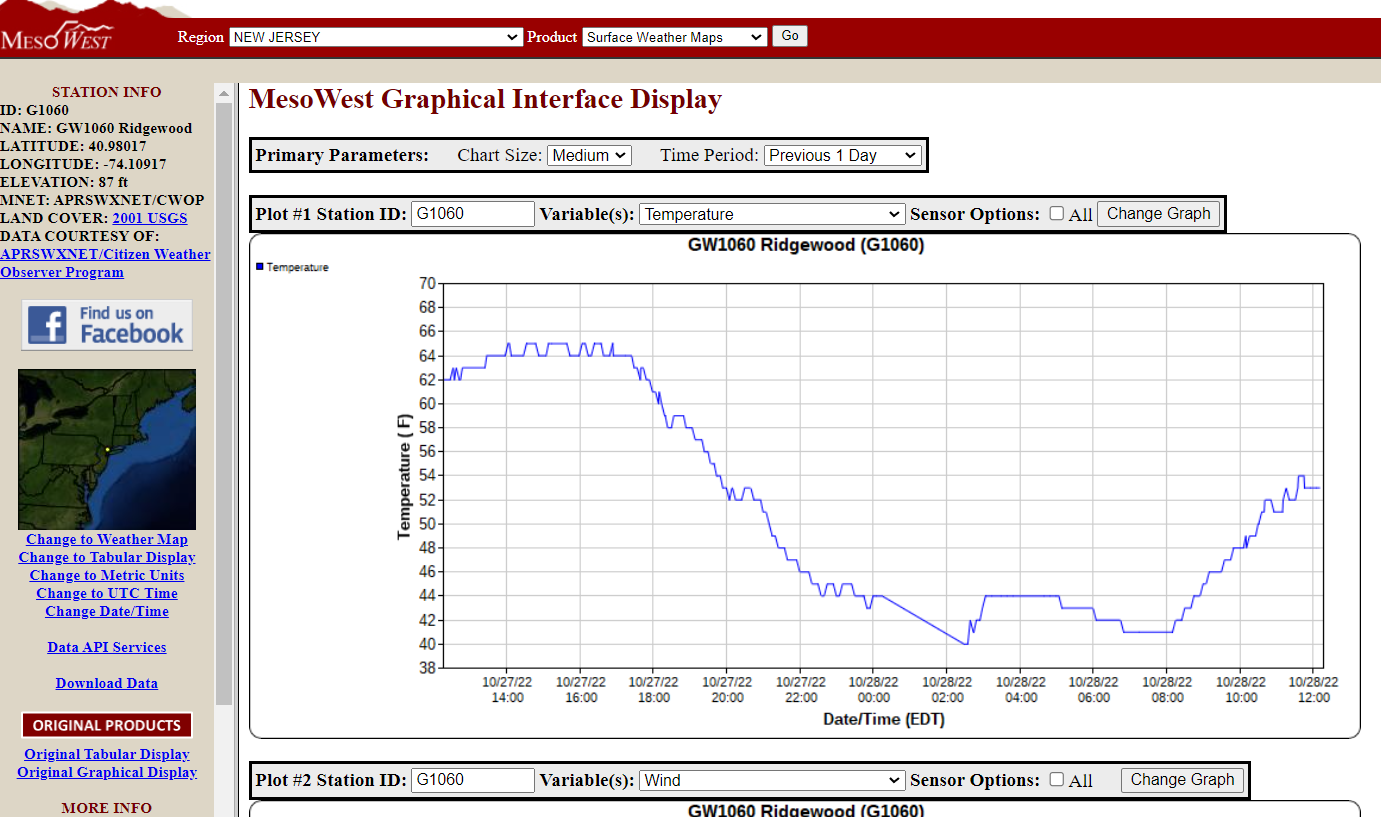
CWOP (Citizens Weather Observer Program - a US government run program I was approved to send data to): link here, or click on the graphic to go to the actual website:
CWOP also shares the information with other cool places like NOAA’s National Weather service, link here, or click on the graphic to go to the actual website:
AWEKAS (Automatisches Wetterkarten System - in german translates to english “Automatic Weather Maps System”) link here, or click on the graphic to go to the actual website:
Wundergound (Weather Underground), link here, or click on the graphic to go to the actual website:
Weather365, link here. They were just bought out I believe by MeteoServices (I also send there, below), so I might stop sending there (it looks on their web site as though they are now only showing data sent for Germany PWS’s anyway - used to be from anywhere).
Met WOW (National Meteorological Service for the UK by order of the crown - WOW (worldwide Weather Observation Website) link here, or click on the graphic to go to the actual website:
OpenWeatherMap link here, or click on the graphic to go to that website:
MeteoServices link here, or click on the graphic for that website:
WindGuru link here, or click on the graphic to go to that website:
AmbientWeather link here, or click on the graphic to go to that website:
Windy link here, or click on the graphic to go to that website:
PWSWeather link here, or click on the graphic to go to that website:
WeatherCloud link here, or click on the graphic to go to that website:


