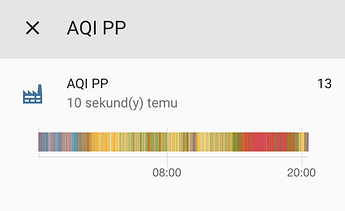
I get a readout of AQI from Xiaomi Air Purifier which is an integer, but instead of line graph Home Assistant plots bar graph, which is basically useless to track changes.
Anyone know how to change it? Here is the sensor config:
  xap_aqi:
    friendly_name: 'AQI PP'
    icon_template: mdi:factory
    value_template: '{{ state_attr("fan.xiaomi_air_purifier_pro", "aqi") }}'