It took me hours to find code examples, I was able to adapt for my needs. Console Log and Chrome Debugger was also helpful.
1 Like
This is great. What if I want the values on the y axis to come from climate entity attributes?
For example:
{{ state_attr('climate.heat_set_1_curvel', 'current_temperature') }}
It returns the correct value in the template devtool but returns an error in plotly.
type: custom:plotly-graph
hours_to_show: current_day
layout:
  xaxis:
    type: number
    showlegend: false
    autorange: reversed
  yaxis:
    fixedrange: true
    range:
      - 10
      - 85
entities:
  - entity: ''
    x:
      - 20
      - -35
    'y':
      - {{ state_attr('climate.heat_set_1_curvel', 'current_temperature')
      - 25
    line:
      shape: spline
Configuration errors detected:
missed comma between flow collection entries (19:73)

 16 |  ...
 17 |  ...
 18 |  ...
 19 |  ... curvel', 'current_temperature') }}
-----------------------------------------^
In your plotly code, there are missing two closing curly brackets at the end of the first y: value.
Here is a visualization for mine:

(documented on 🎨 Add instructions for compensation curve visualization by kamaradclimber · Pull Request #117 · kamaradclimber/heishamon-homeassistant · GitHub)
EDIT: someone nicely remarked my curves are reversed: water is supposed to be hotter when outside is colder  so the correct curves should go down instead of going up. But the code remains very similar.
1 Like
That’s probably just a typo. It makes no difference to the error.
When I quote within the curly brackets, the error stops but the value still does not show up. When saved and come back, it shows [object object] : null.
Finally, woohoo! Thank you @kamaradclimber for the real result to draw nice simple heat curves!

Now my code comes to nice only Plotly code:
      - type: custom:plotly-graph
        refresh_interval: 10
        defaults:
          entity:
            show_value: false
            line:
              shape: line
              width: 2
            mode: lines+markers+text
            texttemplate: '%{y}'
            textposition: top left
        layout:
          xaxis:
            type: number
            autorange: true
        entities:
          - entity: ''
            x:
              - ala
              - kylmä
              - keski
              - lämmin
              - ylä
            'y':
              - >-
                $ex
                hass.states['input_number.hvac_asetusarvo_ulkolampotila_01_alaraja'].state
              - >-
                $ex
                hass.states['input_number.hvac_asetusarvo_ulkolampotila_02_kylmaraja'].state
              - >-
                $ex
                hass.states['input_number.hvac_asetusarvo_ulkolampotila_03_keskiraja'].state
              - >-
                $ex
                hass.states['input_number.hvac_asetusarvo_ulkolampotila_04_lamminraja'].state
              - >-
                $ex
                hass.states['input_number.hvac_asetusarvo_ulkolampotila_05_ylaraja'].state
2 Likes
Thank you @sofa74surfer for your code and image ![]()
It helped a lot in making my own setup by adopting your code to my needs.
Actually my heat pump maker has a tool on their homepage where you can enter the slope and translation (offset) and see what the curve (in their case a straight line) will be.
As you can set the heat pump to follow the “curve” depending on the slope and translation you enter manually into the het pump you can get it to ajdust the outgoing temp based on the slope and translation you have chosen.
By taking into account the outside temp the heat pump follwos the “curve” chosen.
Havig connected the heat pump to HA and having the possibility to set the outgoing temp thru HA I do not need the heat pump itself to adjust the out going temp, but could use my own calcuation and automations (for exampel compensation for heavy wind cooling etc).
Thanks to your code, which I adopted to my own needs I can visualize it in HA and do not need to go the their home page anymore.
Did youever get the auto update to work? I have not looked into it yet, but I get the feeling it has to be edited in the code for the add on instead of the graph code.
Next steps will be do make my own curve which will not be a straight line as when it gets colder normally there is less wind and less moisture in the air which means that you actually might overrun when using a straight line.

Hi,
Total newbie here and would really appreciate some help. I’ve tried the code in the thread but can’t get it to work for me. I want the graph to show the my weather compensation of my heat pump. I have the x1-4 (ambient temp) and y1-4 (flow temp) values, as ‘editable’ climate’s (e.g. climate.ecomode_flow_temp_y1). Can anyone assist please. Ideally i would like the 8 sliders values at the top and the corrsponding graph below. Unless anyone has any better ideas. Many thanks
Hi @robomilo!
Which of the codes did you try out? And can you maybe try draw a curve you are trying to achieve with excel/ drawing program?
Thanks for your reply, this is what i currently have and can directly change the values of the heat pump, they are climate entites. I ideally wanted a ‘curved’ graph underneath.

@robomilo, you seem to have same kind of curve needs as I did.
If you do not need the most beautiful shape of curve, you can try to use my simple plotly code in the couple of answers back:
Yes this is what i wanted! I’m no progammer, i tried the code but could get it to work.
@robomilo, let me try to help and break down what might be the reason for code not working. Firstly, in all these sample codes we are using “Plotly” which is HACS card. Have you installed it?
More info about Plotly in HA:
Hi,
Great stuff but I cant get the proposed code to work as well. Here is my configuration… I have installed “ploty-graph”…
Any ideas what can be wrong? The configuration says (translated from swedish):
"Wrong configuration
- No typ specified."
- type: custom:plotly-graph
  refresh_interval: 10
  defaults:
    entity:
      show_value: false
      line:
        shape: line
        width: 2
      mode: lines+markers+text
      texttemplate: '%{y}'
      textposition: top left
  layout:
    xaxis:
      type: number
      autorange: true
  entities:
    - entity: ''
      x:
        - -15C
        - -10C
        - -5C
        - 0C
        - 2C
      'y':
        - >-
          $ex
          hass.states['input_number.garage_temp_curve_1'].state
        - >-
          $ex
          hass.states['input_number.garage_temp_curve_2'].state
        - >-
          $ex
          hass.states['input_number.garage_temp_curve_3'].state
        - >-
          $ex
          hass.states['input_number.garage_temp_curve_4'].state
        - >-
          $ex
          hass.states['input_number.garage_temp_curve_5'].state
Oh, could it be that you are trying to add manual card only with one element that is plotly-graph? If show, you need to remove ‘-’ in ‘- type: custom:plotly-graph’ so it becomes only ‘type: custom:plotly-graph’.
My own code example comes from multiple cards like code:
...
cards:
  - type: vertical-stack
    cards:
      - type: horizontal-stack
        cards:
...
1 Like

could be some kind of interesting:

Code
type: grid
cards:
  - type: heading
    heading_style: title
    heading: Heat Curve
    icon: mdi:chart-bell-curve-cumulative
    badges:
      - type: entity
        show_state: true
        show_icon: true
        entity: sensor.panasonic_heat_pump_main_outside_temp
        icon: mdi:home-thermometer-outline
        tap_action:
          action: more-info
      - type: entity
        show_state: true
        show_icon: true
        entity: number.panasonic_heat_pump_main_z1_heat_curve_outside_low_temp
        icon: mdi:thermometer-chevron-down
        tap_action:
          action: more-info
      - type: entity
        show_state: true
        show_icon: false
        entity: number.panasonic_heat_pump_main_z1_heat_curve_target_high_temp
        icon: mdi:thermometer-chevron-down
        tap_action:
          action: more-info
      - type: entity
        show_state: true
        show_icon: true
        entity: number.panasonic_heat_pump_main_z1_heat_curve_outside_high_temp
        icon: mdi:thermometer-chevron-up
        tap_action:
          action: more-info
      - type: entity
        show_state: true
        show_icon: false
        entity: number.panasonic_heat_pump_main_z1_heat_curve_target_low_temp
        icon: mdi:thermometer-chevron-up
        tap_action:
          action: more-info
  - type: custom:plotly-graph
    refresh_interval: 10
    defaults:
      entity:
        line:
          shape: spline
    layout:
      xaxis:
        type: number
        autorange: true
    entities:
      - entity: ""
        name: >
          $ex "Water Target Temp " +
          hass.states["sensor.panasonic_heat_pump_main_main_target_temp"].state
          + "°C"
        line:
          width: 1
          dash: dot
        x:
          - >-
            $ex
            hass.states['number.panasonic_heat_pump_main_z1_heat_curve_outside_low_temp'].state
          - >-
            $ex
            hass.states['number.panasonic_heat_pump_main_z1_heat_curve_outside_high_temp'].state
        "y":
          - >-
            $ex
            hass.states['sensor.panasonic_heat_pump_main_main_target_temp'].state
          - >-
            $ex
            hass.states['sensor.panasonic_heat_pump_main_main_target_temp'].state
      - entity: ""
        name: >
          $ex "Outside Temp " +
          hass.states["sensor.panasonic_heat_pump_main_outside_temp"].state +
          "°C"
        value: "1"
        line:
          width: 1
          dash: dot
        x:
          - >-
            $ex
            hass.states['sensor.panasonic_heat_pump_main_outside_temp'].state
          - >-
            $ex
            hass.states['sensor.panasonic_heat_pump_main_outside_temp'].state
        "y":
          - >-
            $ex
            hass.states['number.panasonic_heat_pump_main_z1_heat_curve_target_high_temp'].state
          - >-
            $ex
            parseFloat(hass.states['number.panasonic_heat_pump_main_z1_heat_curve_target_low_temp'].state)
            +
            parseFloat(hass.states['number.panasonic_heat_pump_main_z1_heat_request_temp'].state)
      - entity: ""
        name: >
          $ex "Zone 1 (with request shift of " +
          hass.states["number.panasonic_heat_pump_main_z1_heat_request_temp"].state
          + "°C" + ")"
        x:
          - >-
            $ex
            hass.states['number.panasonic_heat_pump_main_z1_heat_curve_outside_low_temp'].state
          - >-
            $ex
            hass.states['number.panasonic_heat_pump_main_z1_heat_curve_outside_high_temp'].state
        "y":
          - >-
            $ex
            parseFloat(hass.states['number.panasonic_heat_pump_main_z1_heat_curve_target_high_temp'].state)
            +
            parseFloat(hass.states['number.panasonic_heat_pump_main_z1_heat_request_temp'].state)
          - >-
            $ex
            parseFloat(hass.states['number.panasonic_heat_pump_main_z1_heat_curve_target_low_temp'].state)
            +
            parseFloat(hass.states['number.panasonic_heat_pump_main_z1_heat_request_temp'].state)
      - entity: ""
        name: Zone 1
        x:
          - >-
            $ex
            hass.states['number.panasonic_heat_pump_main_z1_heat_curve_outside_low_temp'].state
          - >-
            $ex
            hass.states['number.panasonic_heat_pump_main_z1_heat_curve_outside_high_temp'].state
        "y":
          - >-
            $ex
            hass.states['number.panasonic_heat_pump_main_z1_heat_curve_target_high_temp'].state
          - >-
            $ex
            hass.states['number.panasonic_heat_pump_main_z1_heat_curve_target_low_temp'].state
  - type: tile
    entity: sensor.panasonic_heat_pump_main_outside_temp
    name: Outdoor Temp
  - type: tile
    entity: number.panasonic_heat_pump_main_z1_heat_request_temp
    name: Reqested shift
  - type: tile
    entity: number.panasonic_heat_pump_main_z1_heat_curve_target_high_temp
    name: Water min
  - type: tile
    entity: number.panasonic_heat_pump_main_z1_heat_curve_target_low_temp
    name: Water max
  - type: tile
    entity: number.panasonic_heat_pump_main_z1_heat_curve_outside_low_temp
    name: Out Air min
  - type: tile
    entity: number.panasonic_heat_pump_main_z1_heat_curve_outside_high_temp
    name: Out Air max
1 Like
Hello,
I want to make a graph with the attributes of this entity:

how I can do that?
my code it’s not working:
type: custom:plotly-graph
defaults:
  entity:
    show_value: false
    line:
      shape: line
      width: 2
    mode: lines+markers+text
    texttemplate: "%{y}"
    textposition: top left
layout:
  xaxis:
    type: number
    autorange: true
entities:
  - entity: ""
    x: states.nr_temp_divisoes_graf.attributes.divisao
    "y": states.sensor.nr_temp_divisoes_graf.attributes.temp
Thks
To do it you need a small fix:
x:
      - $ex hass.states['sensor.living_room_temperature'].state
"y":
      - $ex hass.states['sensor.living_room_humidity'].state
and remember to add:
raw_plotly_config: true
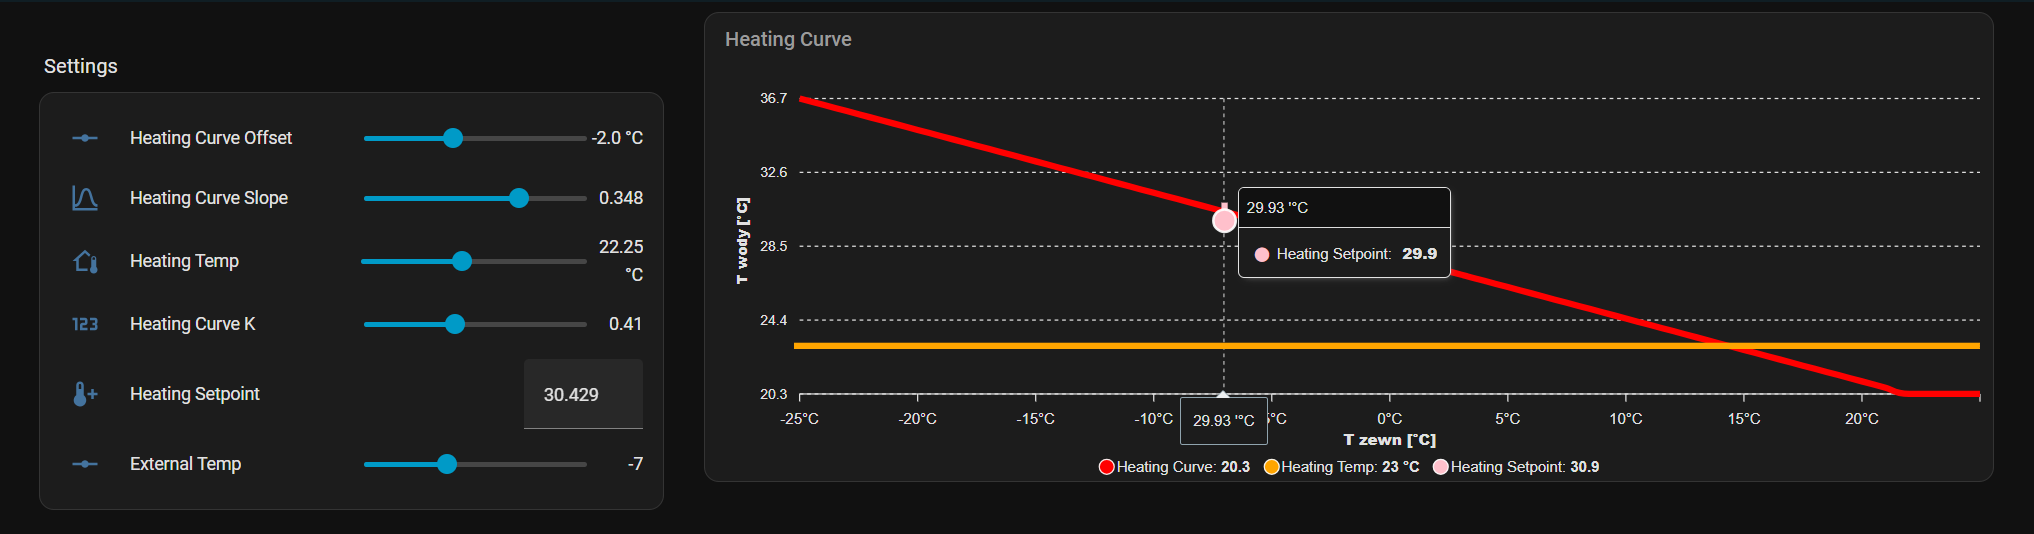
A bit late to the party, but I needed to do something similar and since I got inspiration from here I’m pasting my code.
It dynamically calculates the line based on input parameters (sensors or numbers - code to be edited). Heating set point can then be pushed to Heat Pump, or if HP is driven by ESP32, then the same equation could be used on ESP32 side.
I’ve used apexcharts-card from HACS
Thx for help.
Template number for number.heating_setpoint:
{{
  states('input_number.heating_temp')|float +
  (
    states('input_number.heating_temp')|float
    - states('input_number.external_temp')|float
  ) * states('input_number.heating_curve_slope')|float
  + states('input_number.heating_curve_offset')|float
}}
Entites used:
     input_number.heating_curve_offset
     input_number.heating_curve_slope
     input_number.heating_temp
     number.heating_setpoint # template number calculated based on parameters - also ued to refresh graph
     input_number.external_temp
views:
  - title: Home
    sections:
      - type: grid
        cards:
          - type: heading
            heading_style: title
            grid_options:
              columns: 6
              rows: 1
            heading: Settings
          - type: entities
            entities:
              - entity: input_number.heating_curve_offset
              - entity: input_number.heating_curve_slope
              - entity: input_number.heating_temp
              - entity: input_number.heating_k
              - entity: number.heating_setpoint
              - entity: input_number.external_temp
        column_span: 1
      - type: grid
        cards:
          - type: custom:apexcharts-card
            section_mode: true
            grid_options:
              columns: 24
            header:
              show: true
              title: Heating Curve
            graph_span: 50h
            span:
              start: hour
            series:
              - entity: number.heating_setpoint
                curve: monotoneCubic
                color: red
                name: Heating Curve
                data_generator: >
                  const tRoom =
                  Number(hass.states['input_number.heating_temp'].state); const
                  k = Number(hass.states['input_number.heating_k'].state); const
                  offset =
                  Number(hass.states['input_number.heating_curve_offset'].state);
                  const slope =
                  Number(hass.states['input_number.heating_curve_slope'].state);

                  const points = [];    const base = start.getTime();    const
                  step = 60 * 60 * 1000; // 1h = 1°C

                  for (let tOut = -25; tOut <= tRoom; tOut++) {
                    const idx = tOut + 25;
                    const ts = base + idx * step;
                    const dT = tRoom - tOut;
                    const tSupply = tRoom + dT * slope +  offset;
                    points.push([ts, tSupply]);
                  } return points;
              - entity: input_number.heating_temp
                name: Heating Temp
                color: orange
                data_generator: |
                  return [[0 ,23]];
              - entity: number.heating_setpoint
                name: Heating Setpoint
                color: pink
                extend_to: false
                data_generator: |
                  // how to display this as single point on chart?
                   const base = start.getTime();

                   const step = 60 * 60 * 1000; // 1h = 1°C

                   const external_temp =
                   Number(hass.states['input_number.external_temp'].state);

                   // 25 is the lowest temperature on chart
                   const external_temp_as_date = base + step * (25 - external_temp);
                   const setpoint =  Number(hass.states['number.heating_setpoint'].state);

                   return [[base + step * (external_temp + 25), setpoint-0.5], [base + step * (external_temp + 25), setpoint + 0.5]];
            apex_config:
              chart:
                height: 100%
                width: 100%
              yaxis:
                tickAmount: 0.25
              xaxis:
                tickAmount: 10
                title:
                  text: T outdoor [°C]
                labels:
                  formatter: |
                    EVAL:function (value, timestamp, opts) {
                        const firstTs = opts.w.globals.seriesX[0][0];
                        const step = 60 * 60 * 1000;
                        const idx = Math.round((timestamp - firstTs) / step);
                        const tOut = -25 + idx;
                        return tOut + '°C';
                    }
              tooltip:
                x:
                  formatter: >
                    EVAL:function (value, {series, seriesIndex, dataPointIndex,
                    w}) {
                        if(series === undefined) return "";

                        const temp =  series[seriesIndex][dataPointIndex].toFixed(2);
                        return `${temp} '°C`;

                    }
            yaxis:
              - min: '|+0|'
                max: '|+0|'
                decimals: 1
                apex_config:
                  forceNiceScale: false
                  title:
                    text: T water [°C]
        column_span: 2
    header:
      layout: responsive
      badges_position: bottom
      badges_wrap: wrap