How to enable a Raspberry Pi 4B to monitor device status via modbus/RTU in serial?

Hello. Thank you for coming here, I am asking for helping to solve the below problem. Thank you for your helping!

I want to let the Pi to monitor device status via modbus/TCP and modbus/RTU (serial). However, I faced some problems and I don’t know how to solve it.

I have a Raspberry Pi 4B with installed Home Assistant OS. I use raspberry Pi Imager to install the HA OS with the version 16.1 into a SD card. And I inserted the SD card into the Pi 4B.
I can access the the HA via website. I used LAN wire connect the Pi to internet.

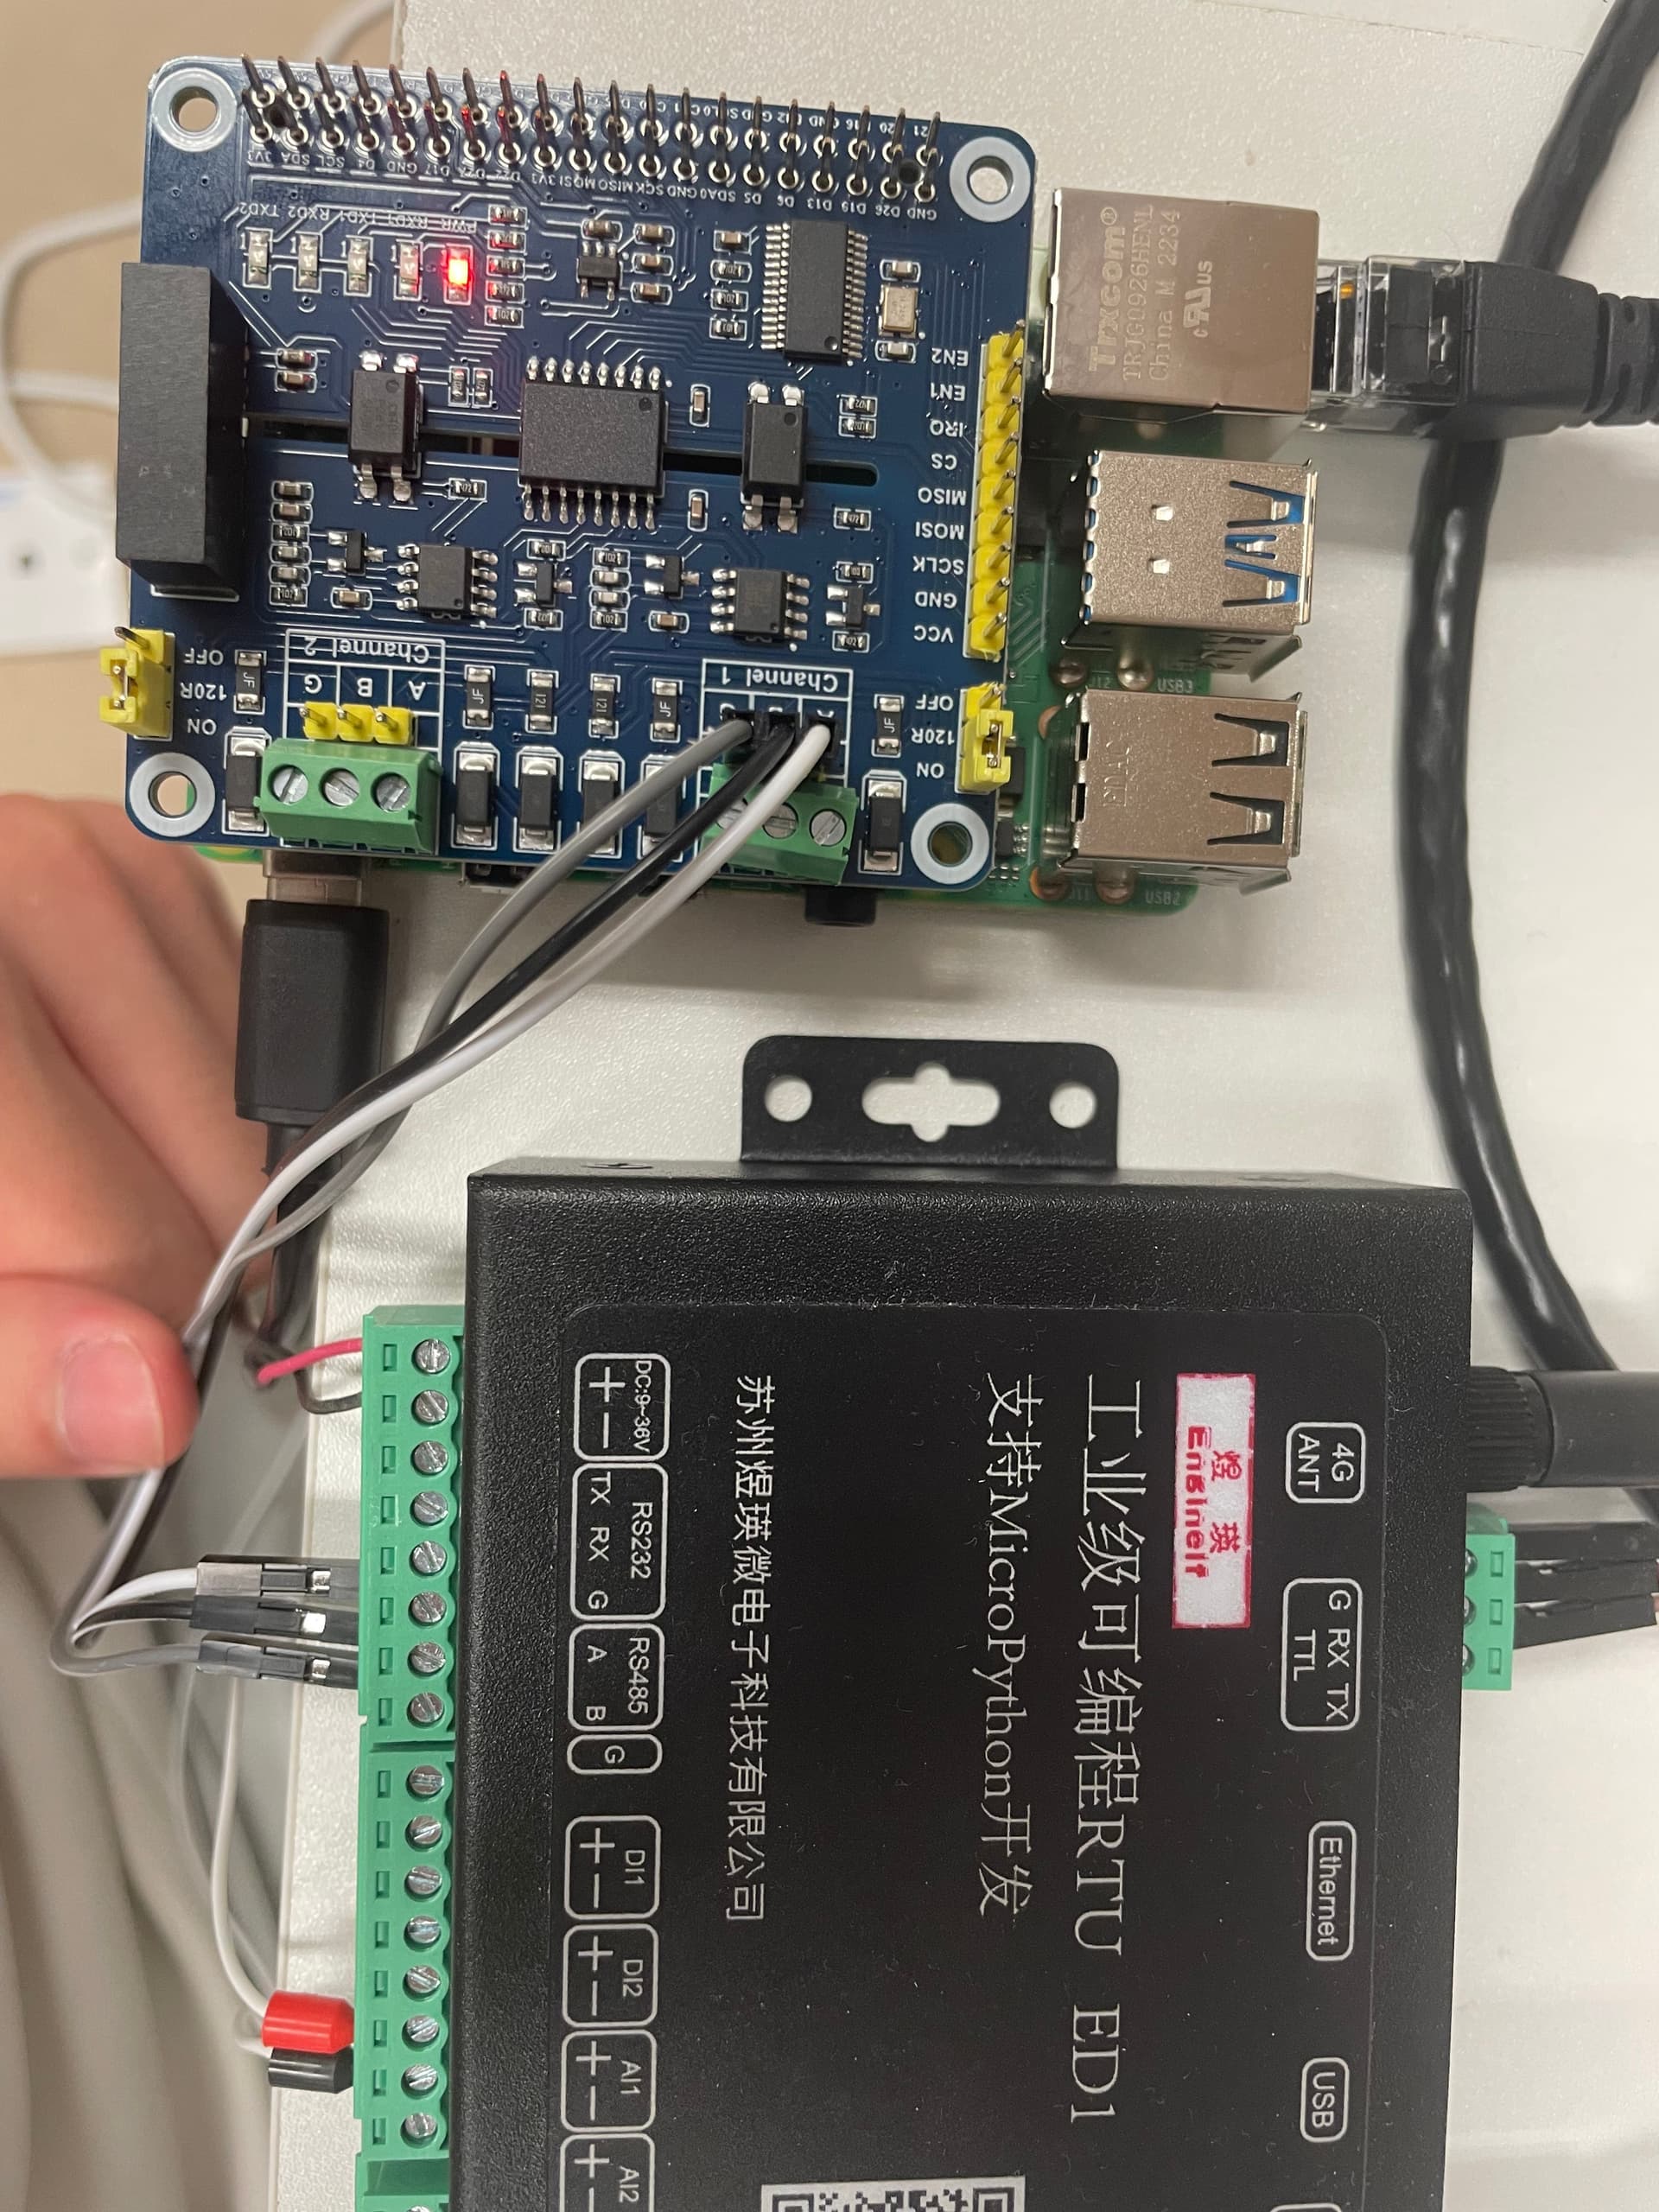
Now I have a modbus RTU ED1 and a RS485 / CAN. I inserted the RS485 / CAN onto the Pi via GPIO pin.

On the other hand, there are a lot of ports in the modbus RTU, I use wire to connect the modbus’ RS485 A and RS485 B port to the RS485 / CAN Channel 1. (The RS485 / CAN only have two Channels, Channel 1 and Channel 2 with three ports in each. With label A,B,G). Please review the photo.

Now I have accessed the configuration file on the HA page.
And I have some sample from the HA

And my configuration file is attached below, now after I restart the HA page, the error shows Modbus modbus_hub contain no entities, causing instability, entry not loaded and Setup failed for ‘modbus’: Integration failed to initialize.

Below is the configuration file of my HA page.

# Loads default set of integrations. Do not remove.
default_config:

# Load frontend themes from the themes folder
frontend:
  themes: !include_dir_merge_named themes

automation: !include automations.yaml
script: !include scripts.yaml
scene: !include scenes.yaml


# Example yaml:  typical serial connection
modbus:
  - name: modbus_hub
    type: serial
    port: /dev/ttyUSB0
    baudrate: 9600
    bytesize: 8
    method: rtu
    parity: E
    stopbits: 1
# Example yaml: entities grouping

  - type: rtu
    host: IP_ADDRESS_1
    port: 2020
    name: "modbus_hub"

Hello, current update from my topic. I have inserted a USB to RS485 Converter into the Pi.
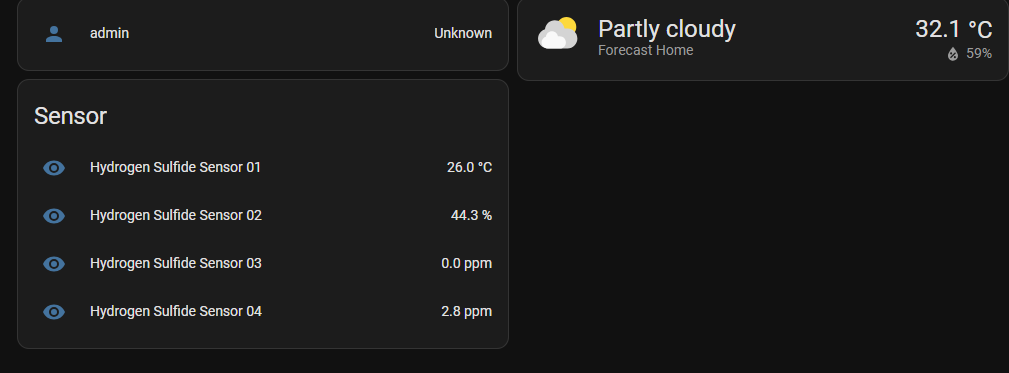
And I have updated the code. Now the HA dashboard can show my sensor data. Therefore, the hardware configuration part can be ignored.

Now I want to update the coding to show CORRECT data.
Since the data now showing on the dashboard are raw data, and I have a formula to calculate the raw data to the readable data.
I have read some forums that suggest me to create a template to achieve it.
However, I am not sure how to do this. Any reply is appreciated!

Below is my most updated code which can show raw data on the dashboard.

# Loads default set of integrations. Do not remove.
default_config:

# Load frontend themes from the themes folder
frontend:
  themes: !include_dir_merge_named themes

automation: !include automations.yaml
script: !include scripts.yaml
scene: !include scenes.yaml


# Example yaml:  typical serial connection
modbus:
  - name: modbus_hub
    type: serial
    port: /dev/ttyUSB0
    baudrate: 9600
    bytesize: 8
    method: rtu
    parity: N
    stopbits: 1
    sensors:
      - name: Hydrogen Sulfide Sensor 01
        slave: 1
        address: 0x01
        input_type: holding
        data_type: int16
        scan_interval: 2
        unit_of_measurement: Celcius
      - name: Hydrogen Sulfide Sensor 02
        slave: 1
        address: 0x02
        input_type: holding
        data_type: int16
        scan_interval: 2
        unit_of_measurement: ' %'
      - name: Hydrogen Sulfide Sensor 03
        slave: 1
        address: 0x10
        input_type: holding
        data_type: int16
        scan_interval: 2
        unit_of_measurement: ppm
      - name: Hydrogen Sulfide Sensor 04
        slave: 1
        address: 0x15
        input_type: holding
        data_type: int16
        scan_interval: 2
        unit_of_measurement: ppm

Hi, is me again. I just updated my code. Now the dashboard can show CORRECT data after I set up the correct offset and scale value.

QUESTION IN HERE.
Now I would like to know how to change the data to a graph data instead of a number only. Any reply is appreciated, thank you!

# Loads default set of integrations. Do not remove.
default_config:

# Load frontend themes from the themes folder
frontend:
  themes: !include_dir_merge_named themes

automation: !include automations.yaml
script: !include scripts.yaml
scene: !include scenes.yaml

# Example yaml:  typical serial connection
modbus:
  - name: modbus_hub
    type: serial
    port: /dev/ttyUSB0
    baudrate: 9600
    bytesize: 8
    method: rtu
    parity: N
    stopbits: 1
    sensors:
      - name: Hydrogen Sulfide Sensor 01
        slave: 1
        address: 0x01
        input_type: holding
        data_type: int16
        scan_interval: 2
        unit_of_measurement: °C
        offset: -20
        scale: 0.01
        precision: 1
      - name: Hydrogen Sulfide Sensor 02
        slave: 1
        address: 0x02
        input_type: holding
        data_type: int16
        scan_interval: 2
        unit_of_measurement: ' %'
        scale: 0.01
        precision: 1
      - name: Hydrogen Sulfide Sensor 03
        slave: 1
        address: 0x10
        input_type: holding
        data_type: int16
        scan_interval: 2
        unit_of_measurement: ppm
        scale: 0.001
        precision: 1
      - name: Hydrogen Sulfide Sensor 04
        slave: 1
        address: 0x15
        input_type: holding
        data_type: int16
        scan_interval: 2
        unit_of_measurement: ppm
        scale: 0.001
        precision: 1

Hi. I just updated my code. Previously, I have asked how to plot the data to a graph instead of a number only, this problem STILL OCCUR. Any reply is appreciated.

Now, I have connected my HA to my influxdb server. The influxdb is opened in a docker compose. Below code is SUCCESSFUL to connect them. I can read data on influxdb.


# Loads default set of integrations. Do not remove.
default_config:

# Load frontend themes from the themes folder
frontend:
  themes: !include_dir_merge_named themes

automation: !include automations.yaml
script: !include scripts.yaml
scene: !include scenes.yaml

# Example yaml:  typical serial connection
modbus:
  - name: modbus_hub
    type: serial
    port: /dev/ttyUSB0
    baudrate: 9600
    bytesize: 8
    method: rtu
    parity: N
    stopbits: 1
    sensors:
      - name: Hydrogen Sulfide Sensor Temperature 
        slave: 1
        address: 0x01
        input_type: holding
        data_type: int16
        scan_interval: 2
        unit_of_measurement: °C
        offset: -20
        scale: 0.01
        precision: 1
      - name: Hydrogen Sulfide Sensor Humidity
        slave: 1
        address: 0x02
        input_type: holding
        data_type: int16
        scan_interval: 2
        unit_of_measurement: ' %'
        scale: 0.01
        precision: 1
      - name: Hydrogen Sulfide Sensor Ammonia
        slave: 1
        address: 0x10
        input_type: holding
        data_type: int16
        scan_interval: 2
        unit_of_measurement: ppm
        scale: 0.001
        precision: 1
      - name: Hydrogen Sulfide Sensor H2S
        slave: 1
        address: 0x15
        input_type: holding
        data_type: int16
        scan_interval: 2
        unit_of_measurement: ppm
        scale: 0.001
        precision: 1
        

influxdb:
  api_version: 2
  host: The_ipaddress_of_the_local_computer
  ssl: false
  port: 8086
  token: The_real_token_of_your_influxdb
  organization: The_real_organizationID_of_your_influxdb
  bucket: HomeAssistant
  tags:
    source: HA
  tags_attributes:
    - friendly_name
  default_measurement: units
  include:
    entities:
      - sensor.hydrogen_sulfide_sensor_temperature
      - sensor.hydrogen_sulfide_sensor_humidity