Pieter, how do I run this query against my home assistant?
It would depend on your installation method. I run core, so I can access my DB via a terminal on the same host. If you use HAOS, I think there’s an add-on you can install to get access to the SQLite DB, but I’m not sure, to be honest.
ok thank you
I don’t think you can delete records with the add-on. Anyway, I just copy the .db file to my laptop and run DB Browser for SQLite there. Fast, easy and I don’t mess with the live copy. If I want to do any DB maintenance, like deleting data, I do this while I have HA shutdown for an update or whatever anyway. And always keep a backup copy before making any changes, of course.
1 Like
A couple days ago I had a MariaDB of 55GB.
Now I just managed to get my SQLite db to 175MB thanks to this thread. Omfg. And this is not even diving deep. Wow.
Obv my initial setting of 720 days to be retained wasn’t right. I did not know about long term statistics, so I wanted to keep everything. After learning that and purging down I went down to 1GB, and then I migrated to SQLite as I learned how it was improved last year from HA team.
Then I arrived to this thread, and tbh I wasn’t expecting much. I have only focused on states and disabling the worst entities I found in the states table. Got it down to 500MB first, and now I disabled a few more entities. I did not expect it to go down to 175MB, really. I could carry on, but tbh I am more than happy as it is.
Many thanks for the amazing guide.
What I wanted to ask is exactly how is this table helpful. While the states table served me to purge the heavy entities, what can I do knowing that the state_attributes is the heavyweight here? Is there something I can do to trim it down?

Same for the events table. I can see a few culprits, but no clue how to attack them.

This is something I’ve been exploring, too. It would seem that some entities have a very large number of “attributes” associated with them. Apparently every time the state changes, a new state_attributes record is also stored. Or maybe it’s just when any of the attributes is also changed, I’m not clear on that yet.
The point is, these attributes (which are stored in an extremely verbose JSON format, in which includes the field names - all of them - and values) are repeated over and over again in every single record. This can be result in some pretty intense database spam.
So, look for entities which store lots of attributes. I’ve found browsing the Developer Tools / States page is a good starting point. There’s also an SQL query here which can help. I think you’ll be shocked at what you find.
1 Like
Thanks!
Re the attributes, yeah, I could see some are very lengthy. But again, is there a way of telling the recorder to store the value without attributes or with selected attributes? Or is the only solution to filter the entity again completely?
Thanks for those new queries. The first one about states is a simpler version about the one in the guide really. It didn’t show anything new.
And the other one shows the same but in the long term statistics table. Which I don’t think it’s too useful. In that table all entities are reduced to 1 entry per hour AFAIK. Which means the ones with more entries are your oldest entities (in my case it matches perfectly, also with the number of hours my HA has been running). That’s 24 new entries per entity per day. And these are never purged by HA, since their impact is very low.
But again, that’s adding very little to your db compared to the numbers from the short-term data, which might be registering every few seconds.
Also leaving here the tables query in MB as I find it more descriptive than bytes.
SELECT
  SUM(pgsize) / (1024 * 1024) AS MB,
  name
FROM dbstat
GROUP BY name
ORDER BY MB DESC
Edit: I think you guys will like this query I created with some help from ChatGPT.
This will tell you which entities are the heavyweights in state_attributes exclusively, and how much in MB they use.
The 2 notification count sensors on my 2 phones are taking 15MB themselves. You know where they’re going.
After filtering a few of the culprits, 180MB down to 115MB now. ![]() This is SO addictive.
This is SO addictive.
SELECT
    ROUND(SUM(LENGTH(shared_attrs) / (1024.0 * 1024.0)), 2) AS attrs_size_mb,
    ROUND((SUM(LENGTH(shared_attrs) / (1024.0 * 1024.0)) * 100) / (SELECT SUM(LENGTH(shared_attrs) / (1024.0 * 1024.0)) FROM state_attributes), 2) AS size_pct,
    COUNT(*) AS cnt,
    COUNT(*) * 100 / (SELECT COUNT(*) FROM state_attributes) AS cnt_pct,
    states_meta.entity_id
FROM
    state_attributes
INNER JOIN
    states ON state_attributes.attributes_id = states.attributes_id
INNER JOIN
    states_meta ON states.metadata_id = states_meta.metadata_id
GROUP BY
    states_meta.entity_id
ORDER BY
    attrs_size_mb DESC;
In a word, no. For attribute-heavy entities (and there are a lot of them) the best we can do is exclude the entity, then create a template to hold only the value you’d like to keep.
Be careful when defining your templates, too. Giving them things like unit_of_measurement, friendly_name or icon adds those as attributes. So you can end up with the same problem.
Remember, these attributes are stored as JSON strings with each variable name and value spelled out in ASCII text. So while you think you’re only storing a binary or numeric value, you’re actually storing a long, multi-value string with every state change.
Anyway, here’s the SQL I use to see the heavy hitters in the state_attributes table. I can’t claim authorship:
SELECT
  COUNT(state_id) AS cnt,
  COUNT(state_id) * 100 / (
    SELECT
      COUNT(state_id)
    FROM
      states
  ) AS cnt_pct,
  SUM(
    LENGTH(state_attributes.shared_attrs)
  ) AS bytes,
  SUM(
    LENGTH(state_attributes.shared_attrs)
  ) * 100 / (
    SELECT
      SUM(
        LENGTH(state_attributes.shared_attrs)
      )
    FROM
      states
      JOIN state_attributes ON states.attributes_id = state_attributes.attributes_id
  ) AS bytes_pct,
  states_meta.entity_id
FROM
  states
LEFT JOIN state_attributes ON states.attributes_id = state_attributes.attributes_id
LEFT JOIN states_meta ON states.metadata_id = states_meta.metadata_id
GROUP BY
  states.metadata_id, states_meta.entity_id
ORDER BY
  cnt DESC;
3 Likes
No prob. As I said, I’m more than happy now. Just checked your query but I prefer mine tbh, as it’s in MB and sorted for size, not count.
Also noticed my db went down once again, this time down to 80MB. Not even sure why this time, but it must be one of the previous changes hadn’t made an effect yet. 55GB to 80MB. Not even in my wildest dreams.
So my database is suddenly 10GB. Trying to get some stats from the dbstat seems impossible. Nothing happens when I try to pull data from it via SQLite Web. I get no errors. Is this a timeout? If so, what can I do? Can I purge some data to get head over water again?
Best option: Stop HA, copy home-assistant_v2.db to another machine, re-start HA. Run DB Browser for SQLite (or any similar tool) on that other machine. After figuring out what you need to purge, do so from Developer Tools / Services in the HA UI. Be sure to exclude the offending entities so it doesn’t happen again.
Nuclear option: Stop HA, delete the home-assistant_v2.db file. HA will create a new one when it restarts. You lose all history and statistics data prior to the delete, but you have a clean DB.
2 Likes
Thanks a lot! Appreciate it! I went nuclear (didn’t even stop HA. Just moved the database file in case of emergency, and restarted) ![]() - and it solved all my problems. Database is restarted, and I’m able to get the stats I need from “dbstat” to do some filtering.
- and it solved all my problems. Database is restarted, and I’m able to get the stats I need from “dbstat” to do some filtering.
EDIT: Also found what’s causing the database reaching 10GB. (Thanks to OP!) Must have done something wrong when reconfiguring a raspberry pis system sensors python script which was reporting every second over MQTT all system stats.
1 Like
So I’ve discovered my database is 15 Gb and growing but when I’m trying to run the queries above to determine what entities/sensors are taking up the most room they keep timing out, and I’m assuming that is because the database is too big. Any way to increase the timeout limit on queries so that I can figure out what is actually going on here?
1 Like
Had the same issue. I ended up just deleting the database. What I didn’t try was limiting the query. Try this:
– Updated query Dec 2023
SELECT
COUNT() AS cnt,
COUNT() * 100 / (SELECT COUNT(*) FROM states) AS cnt_pct,
states_meta.entity_id
FROM states
INNER JOIN states_meta ON states.metadata_id=states_meta.metadata_id
GROUP BY states_meta.entity_id
ORDER BY cnt DESC
LIMIT 15
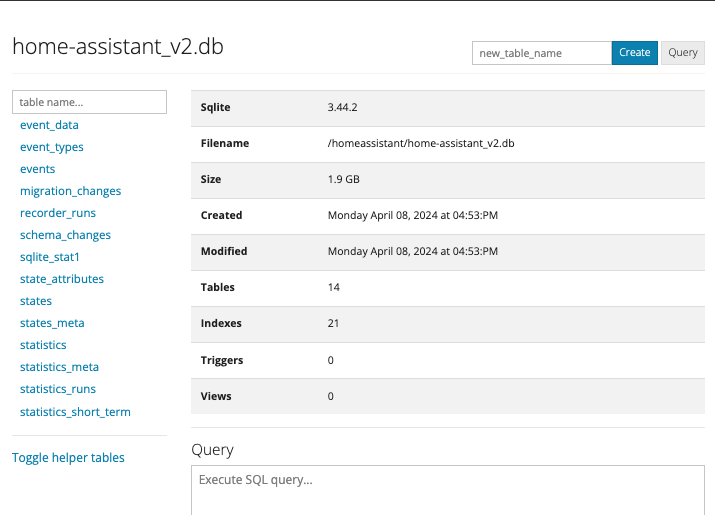
My database is 1.9GB
When I use this query
SELECT
  COUNT(state_id) AS cnt,
  COUNT(state_id) * 100 / (
    SELECT
      COUNT(state_id)
    FROM
      states
  ) AS cnt_pct,
  SUM(
    LENGTH(state_attributes.shared_attrs)
  ) AS bytes,
  SUM(
    LENGTH(state_attributes.shared_attrs)
  ) * 100 / (
    SELECT
      SUM(
        LENGTH(state_attributes.shared_attrs)
      )
    FROM
      states
  ) AS bytes_pct,
  states_meta.entity_id
FROM
  states
LEFT JOIN state_attributes ON (states.attributes_id=state_attributes.attributes_id)
LEFT JOIN states_meta ON (states.metadata_id=states_meta.metadata_id)
GROUP BY
  states.metadata_id
ORDER BY
  cnt DESC
And then make the sum of the bytes column in a spreadsheet I have 696.367MB
How can I find out where all other disk space us used?
1 Like
Presumably, in some of the other tables besides state_attributes and states_meta, where your query is looking. I’d look at the statistics table next:
SELECT
  statistics_meta.statistic_id,
  count(*) cnt
FROM
  statistics
  LEFT JOIN statistics_meta ON (
    statistics.metadata_id = statistics_meta.id
  )
GROUP BY
  statistics_meta.statistic_id
ORDER BY
  cnt DESC;
Admittedly this doesn’t give the space utilization, but it should give you an idea of the scale of the problem. I have no use for these “statistics” tables and have been know to simply purge them. I wish there were an option to not populate them in the first place.
I don’t think the statistics table is the problem.
When I execute that query it shows me that I have 46 results.
The highest count is 22888, but indeed I don’t know the space utilization.
But I don’t know where to search further.
Maybe someone can adapt the statistics query so it shows also the space utilization?
When you add this to your customize.yaml
sensor.xxxxxx:
  state_class: none
You can delete them in the statistics dashboard
2 Likes
To get a proper offline copy of your HA database, the following procedure can be used:
Make a full backup of your HA system using Settings - System - Backups - CREATE BACKUP (select full). When finished, click on the created backup and select the three dots - Download backup
In Save as-dialog, select some place to do the analysis.
On Windows, with 7z installed, ‘Extract files…’, creates a directory with several .tar.gz-files
The one of interest is homeassistant.tar.gz.
‘Extract Here’ produces homeassistant.tar and then ‘Extract files…’ creates a directory homeassistant where the subdirectory data has (among others) home-assistant_v2.db, which is the SQLite database.
The analyzer sqlite3_analyzer.exe is available for download from SQLite Download Page
and documented at The sqlite3_analyzer.exe Utility Program
Running sqlite3_analyzer creates a detailed study of the database
sqlite3_analyzer home-assistant_v2.db > analyzis
1 Like
If I try the SQL’s to get the heavy hitters states I often get a error in phpMyAdmin. Possibel timeout because the SQl is running to long on my system.
Error:
Error in Processing Request
Error Text: error (rejected)
It seems that the connection to the server has been lost. Please check your network connectivity and server status.
Everybody know how I could expand the runntime to get a result for the SQL:
SELECT
  COUNT(state_id) AS cnt,
  COUNT(state_id) * 100 / (
    SELECT
      COUNT(state_id)
    FROM
      states
  ) AS cnt_pct,
  SUM(
    LENGTH(state_attributes.shared_attrs)
  ) AS bytes,
  SUM(
    LENGTH(state_attributes.shared_attrs)
  ) * 100 / (
    SELECT
      SUM(
        LENGTH(state_attributes.shared_attrs)
      )
    FROM
      states
      JOIN state_attributes ON states.attributes_id = state_attributes.attributes_id
  ) AS bytes_pct,
  states_meta.entity_id
FROM
  states
LEFT JOIN state_attributes ON states.attributes_id = state_attributes.attributes_id
LEFT JOIN states_meta ON states.metadata_id = states_meta.metadata_id
GROUP BY
  states.metadata_id, states_meta.entity_id
ORDER BY
  cnt DESC;
Thanks