Original post: https://smarthomepursuits.com/how-to-monitor-devices-in-home-assistant/

In this guide, I’m going to show you how to monitor Home Assistant entities or network devices, and then display the status in a beautiful Lovelace card.
Step 1: Add PING to Home Assistant
Before you can start monitoring devices and entities, you need to add the PING to Home Assistant. To do this, open File Editor and open your configuration.yaml file. For this example, I am going to be monitoring my router which has an IP address of 192.168.68.1.
First, check if you already have a binary_sensor: field in configuration.yaml. If you do, add the code below replacing it with your router’s IP address. The default number of packets sent is 5, and the default scan interval is 5 minutes, but I am changing those variables below. This will create a new binary sensor for you to start tracking.
  - platform: ping
    host: 192.168.68.1
    name: Router
    count: 8
    scan_interval: 30
If you don’t have any binary sensors added to configuration.yaml yet, then the code to add would look like this:
binary_sensor:
  - platform: ping
    host: 192.168.68.1
    name: Router
    count: 8
    scan_interval: 30
If you are adding multiple devices, then it would look like this:
binary_sensor:
  - platform: ping
    host: 192.168.68.1
    name: Router
    count: 8
    scan_interval: 30
  - platform: ping
    host: 192.168.68.137
    name: Danny-Server
    count: 8
    scan_interval: 30
  - platform: ping
    host: 192.168.68.141
    name: Danny-Docker
    count: 8
    scan_interval: 30
You can add ANY devices with an IP here – phones, printers, smart TV’s , raspberry pi’s, cameras, etc. You will just need to know the IP address of each device, as hostname will not work. You should be able to grab the IP address from the device itself or by logging into your router.
Save the configuration and then reboot Home Assistant.
Step 2: Display Status in Lovelace
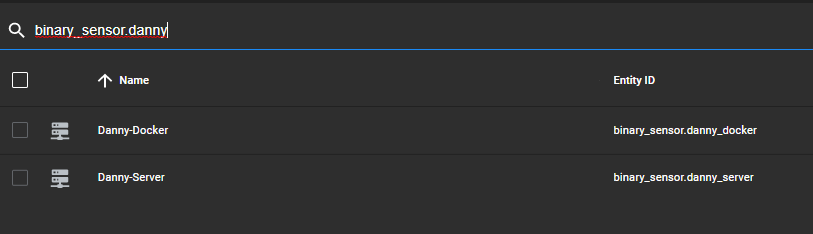
The next step is to display the status in a Lovelace card. Before you do that, you should figure out what your newly created binary sensors are called by going to Configuration > Entities > search for binary.sensor
Then, install the Uptime Card via HACS.
Once installed and reloaded, add a new card.

From here, you can either search for one of the binary sensors you just created or copy and paste my YAML below by clicking the Show Code Editor button. My code below only shows the status over the last hour but you can change this whatever you’d like.
type: custom:uptime-card
entity: binary_sensor.router
icon: mdi:raspberry-pi
name: Router
hours_to_show: 1
status_adaptive_color: true
color:
  icon: grey
show:
  footer: false
alias: {}
bar: {}
update_interval: 30

Step 3: Create Automation To Alert When Device Is Offline
The next step is pretty easy and highly customizable. You can make use of standard notifications or even actionable notifications (i.e. – display a button to “Open Portainer” so you can restart Docker, for example)
Create a new automation with the following values:
Triggers:
- Trigger Type: State
- Entity: choose a binary sensor entity
- To: off
Actions:
- Action Type: Call service
- Service: notify.mobile_app_pixel_5_danny
- Message: Your docker host has went offline
- Title: Danny-Docker went offline!
alias: Notify When Danny-Docker Goes Offline
description: ''
trigger:
  - platform: state
    entity_id: binary_sensor.danny_docker
    from: 'on'
    to: 'off'
condition: []
action:
  - service: notify.mobile_app_pixel_5_danny
    data:
      title: Danny-Docker went offline!
      message: Your host host has went offline.
mode: single
For testing, I simply disabled the network adapter on my docker VM. Because I set my scan interval to 30 seconds, I will receive within 30 seconds if it comes online. If you add your phone, you can also just turn the wifi off as a quick test.
You can now create a 2nd automation to change from Off to On to be notified when your devices comes back online.
Here’s what your notification will now look like:


