trying to get my Solaredge statistics into an entity (so I can show those in regular cards, not only statistics)
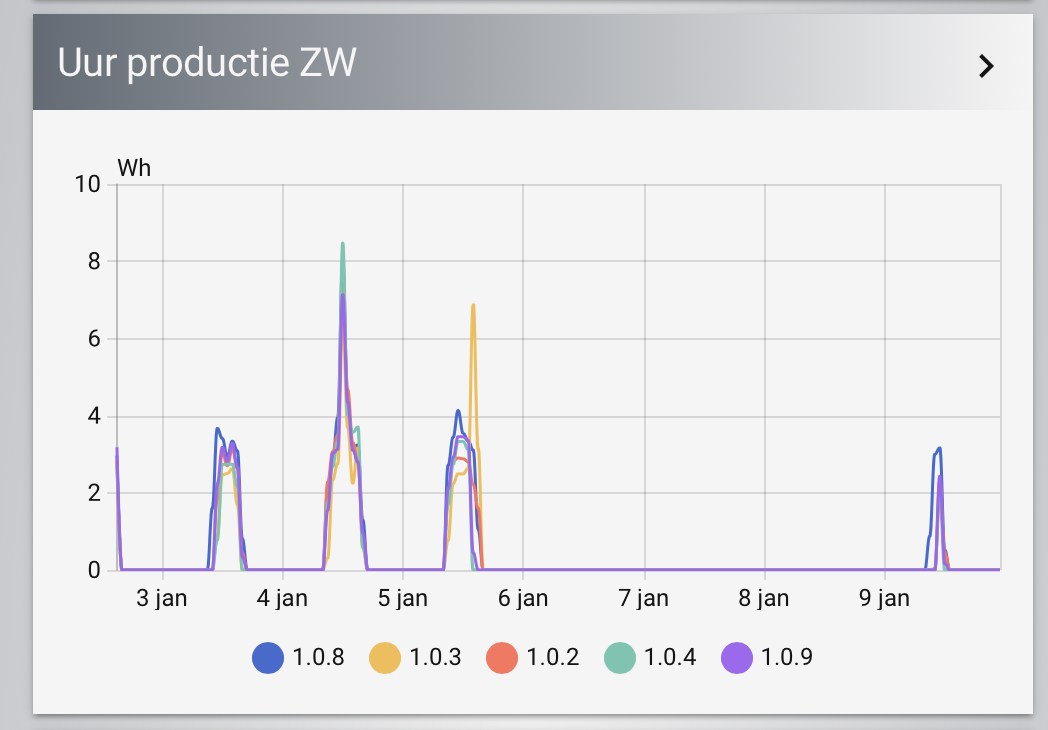
In the end, I’d like to see this (and of course higher numbers… this is snowy panel output ;( )
note todays tiny spike.
with help I’ve already created something like this:
template:
  - triggers:
      - trigger: time_pattern
        minutes: /10
      - trigger: homeassistant
        event: start
      - trigger: event
        event_type: event_template_reloaded

    actions:
      - action: recorder.get_statistics
        response_variable: optimizer_stats
        data:
          start_time: >
            {{now()- timedelta(hours=24)}}
          end_time: '{{now()}}'
          period: hour
          types:
            - state
#             - sum
          statistic_ids:
            - solaredge:<site-id>_257024037 #1.0.8
            - solaredge:<site-id>_257024042 #1.0.3
etcetc
    sensor:

##########################################################################################
# ZW
##########################################################################################
      - name: SolarEdge optimizer 1.0.8
        unique_id: solaredge_optimizer_1.0.8_statistics
        variables:
          panel: 257024037

        <<: &optimizer_config
          unit_of_measurement: W
          device_class: power
          state_class: measurement
          state: >
            {{this.attributes.stats[0].state|round(0) if this.attributes.stats is not none else -1}}
          attributes:
            stats: >
              {{optimizer_stats.statistics.get('solaredge:'~site~'_'~panel)}}
#             site-id: >
#               {{site}}
            panel: >
              {{panel}}
#             sum: >
#               {{stats[0].sum|round(0) if stats|length > 0 else 'Niet beschikbaar'}}
            last_updated: '{{now()}}'

      - name: SolarEdge optimizer 1.0.3
        unique_id: solaredge_optimizer_1.0.3_statistics
        variables:
          panel: 257024042
        <<: *optimizer_config
et etc
and those seem to work.
However, I cant see the values as shown in the statistics graph.
So, looking for help, on finding what those stock statistics cards do to get the smoother graph, and more importantly, reveal those details.
as it stands, I can not add a 5minutes period, is renders an empty response. I can not use mean/max/min options either, they are simply not returned in the response at all.
I can use Sum, but that value is not useful (I think) as it does not represent any actual power summation.
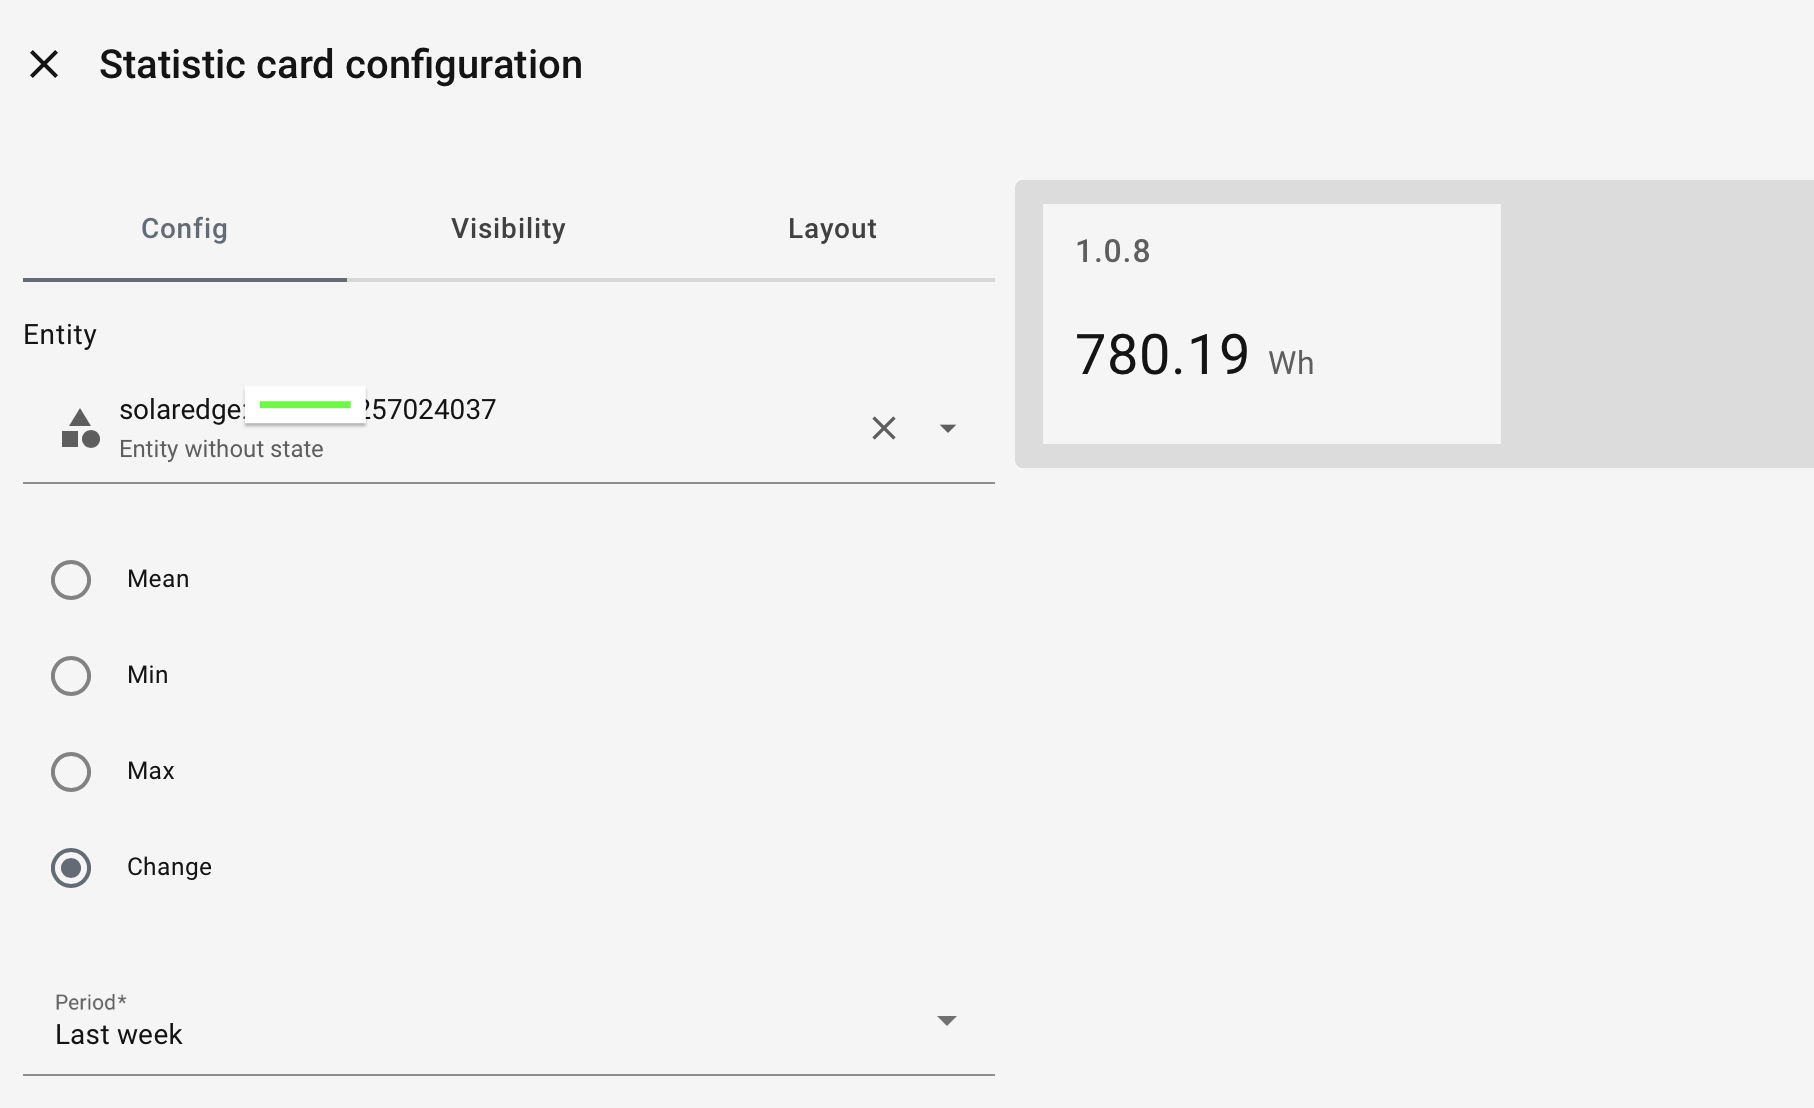
This seems to be the same as using a Statistic card, where those options return a ? and we can only use ‘change’
I started out with an hour timeframe like {{now()- timedelta(hours=1)}} to get the ‘now’ value and trigger per hour, but as said, Id like to get to a smoother sequence, so figured to widen that period. And up the trigger frequency.
doesnt really help.
I cant see the spikes in the graph:
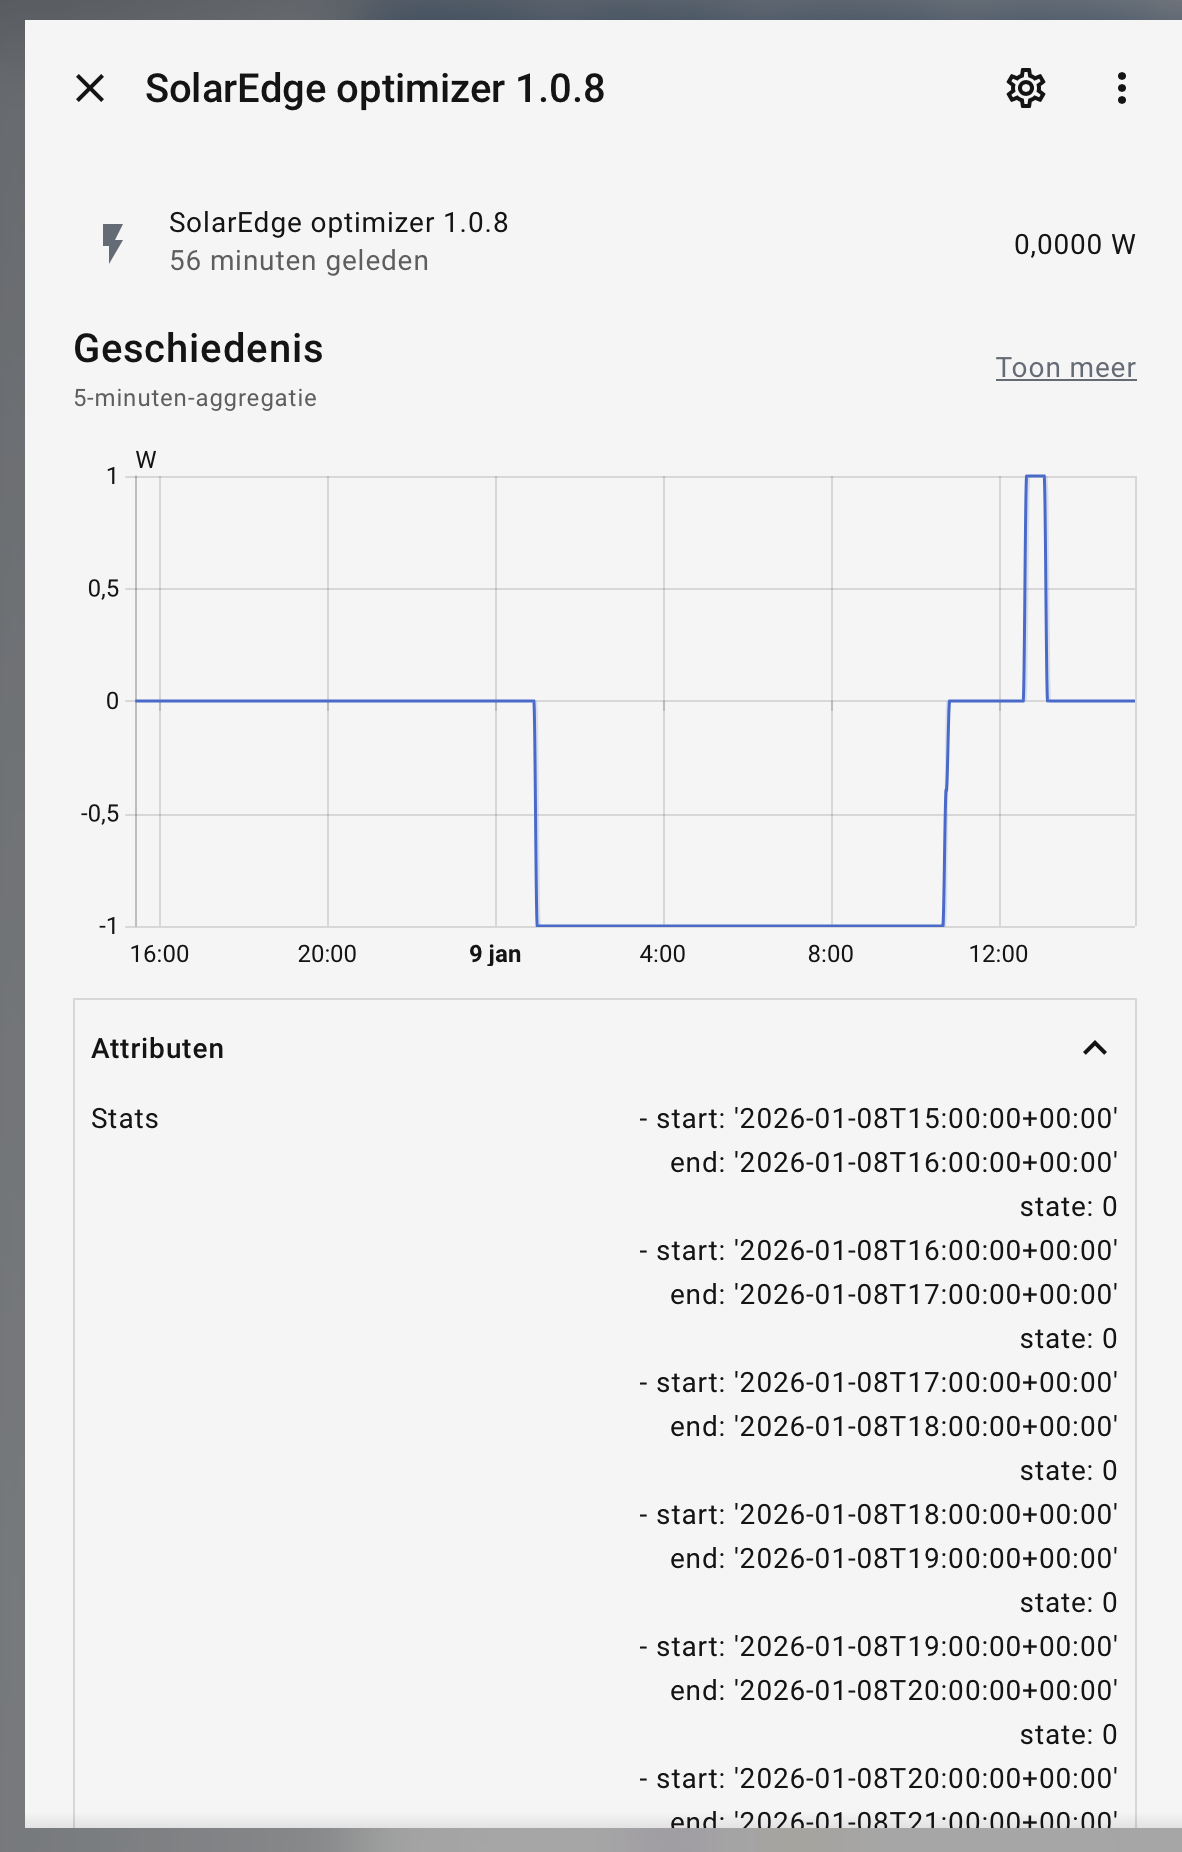
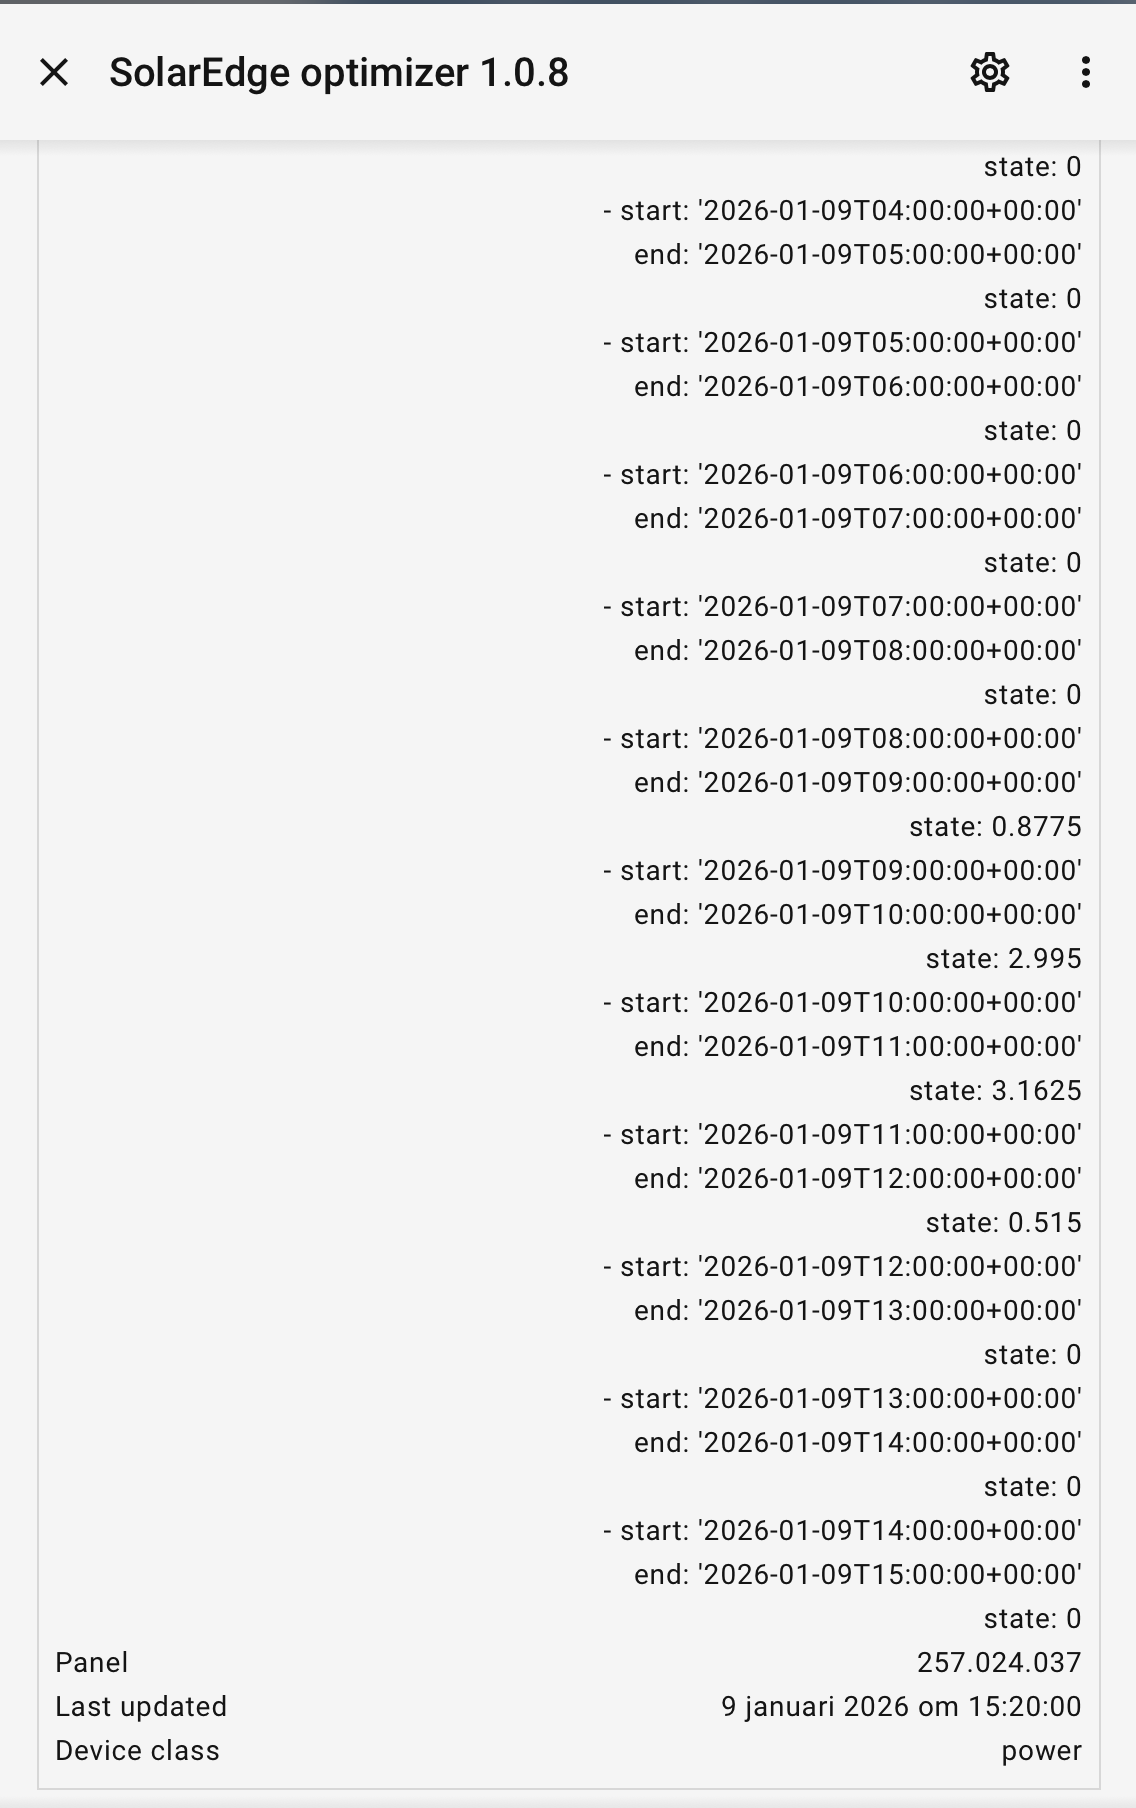
even though there is proof it went above the. 1 w at some point…
Any suggestions to make this more useful?
Omt, I also followed the documentation and made the SQL sensors.
I have 3 formations, and 1 can actually simply use the ‘like’ query from that documentation.
2 other formation however need to be pointed directly to individual panels, and I now managed to do that with:
AND sm.name LIKE '%1.0.2%'
 OR sm.name LIKE '%1.0.3%'
 OR sm.name LIKE '%1.0.4%'
 OR sm.name LIKE '%1.0.8%'
 OR sm.name LIKE '%1.0.9%'
which seems a bit verbose. could that be improved?