How to set up Octopus Go (or other dual rate tariff) in Energy Dashboard

Hi Steve,

I’ve been struggling with this also. You mention 3 helpers, one for each tariff (peak and cheap) but what’s the 3rd helper? Is that the one actually collecting the usage data?

I don’t suppose you have some screenshots of those sensors being setup do you? I’m missing something obvious I fear.

Mark

Sorry only just seen this.
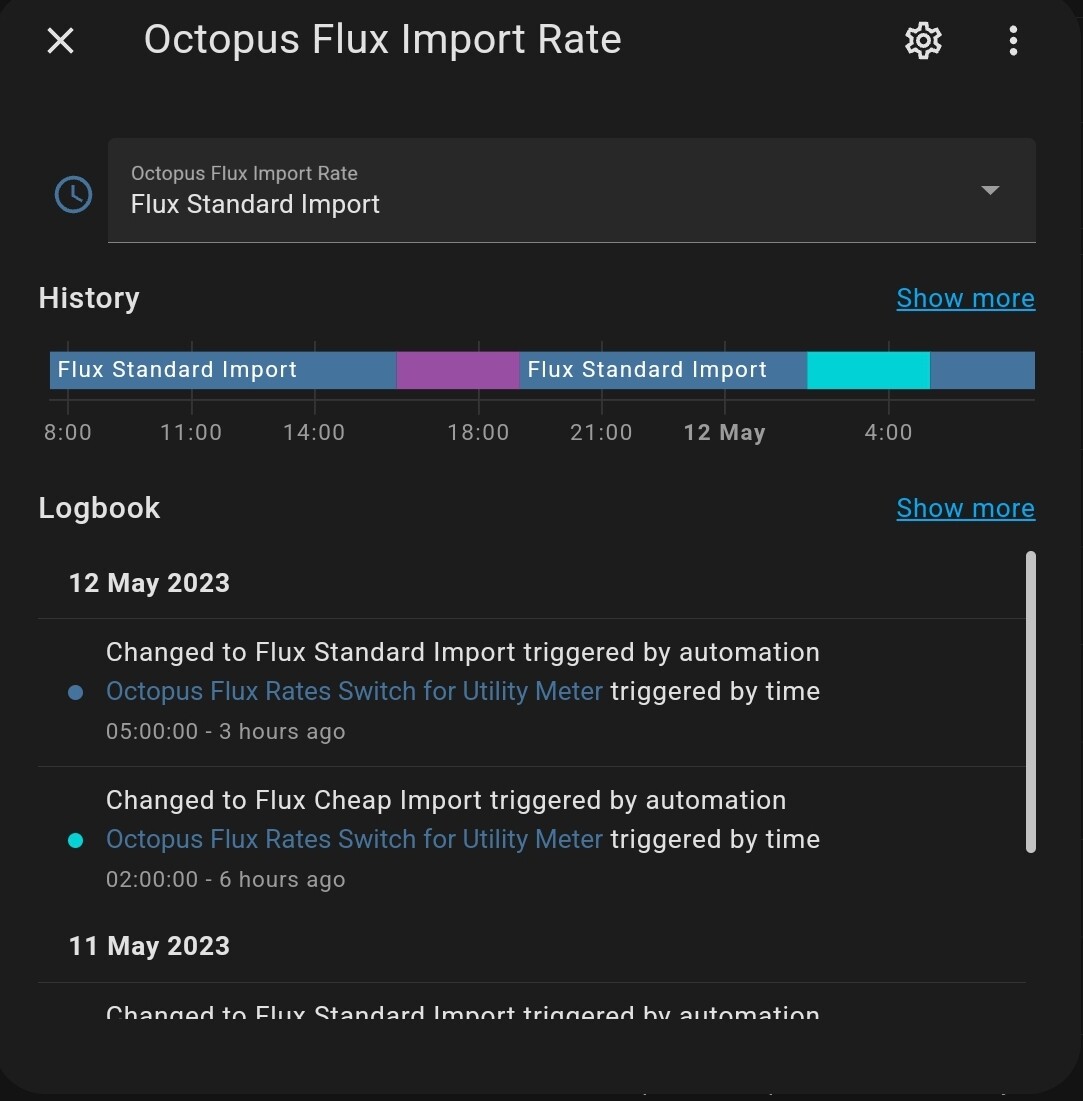
The three helpers are shown in the screenshot - they are the two meters and the selector - the one with the clock symbol, it selects which of the two meters is to be used.

All three are created by the utility meter integration.

What happens when you set up the utility meter? What helpers are created?

Cheers

Hi Steve

No worries. The utility wasn’t creating the selector helper for me, only the two meters. I’ve subsequently seen others reporting the same thing.

Ive dropped the utility and got it working with some raw yaml now though.

Mark

I’ve done the same as you.
Are you adding your standing charges to the energy dashboard as well ? If so how you doing it

No I’ve not bothered with the standing charge. I know what it is each month and I can’t influence it so haven’t bothered.

Good luck

Hi
Thanks for the reply I actually found a way of doing the standing order and worked great.
Here
So you create this sensor just change the date to yesterdays date then when you’ve created the sensor go to the energy dashboard and add the sensor as consumption with a static price X 1000
So my standing is 43.35p per day when I added my sensor I put the static price as 433.5 and it has worked well so far.

Hi steve_jo,
Thanks for this, it certainly helped me get the dual tariffs up and running. I’ve 1 issue that I cant seem to solve. I’ve dual inverters, so 2 grid import sensors and have created two sets meters which seems correct. When I add them to the electrical grid section and set the static price, they provide the cost value. It seems however that the values are being accumulated into the energy usage total i.e it thinks I’m consuming twice of my actuals ?

Any suggestions ?

Sorry I don’t understand. Please can you explain what your inverters have to do with grid import?
They might measure it as part of your solar or storage system but there’s only one wire with power coming in (3 phase excepted). Why wouldn’t you just use one sensor/meter?

Good luck

Thanks, got you.
Will use the CT sensor to evaluate the peak & off peak. Was confusing my self with the 2 sets of data I get from the dual inverters. Your ofcourse correct, the CT measures everything out & in

Hi Steve_jo, I’m having the same issue as others. The clock symbol (selector) doesn’t generate when using Utility Meter

Sorry I’m not an expert. What helpers does the utility meter integration set up for you?

This thread is a bit old, but in case it helps I can add a bit more detail as I went through this yesterday. I will also show the traps I fell in
The 3 helpers created are these


The top one has a drop down to flip between peak and off peak
image

It is then necessary to set up an automation to flip between the two (or more) rate settings. I have a switch for peak / off peak already so I just used that as the trigger. It didn’t work at first and I found these two issues, because I copied someone else’s script

  1. Peak is not the same as peak, check your case is correct.
  2. I made errors on the entity name, based on my screenshot above I needed select.electricity_meter
1 Like

Is there a timing issue around when the helper sensors become valid as grid consumption sensors?

I’ve set everything up a couple of days ago, the helpers are counting peak and off peak usage in kWh, but the energy dashboard is not letting me add them to the Grid Consumption area.

Does that mean the utility meters don’t appear in the drop down in settings - dashboards- energy - add consumption? I’ve only had problems if the sensors weren’t actually counting.

Have you tried a restart (sorry know it’s a cliche)? Do you see any sensors offered in the drop down?

Good luck

It must be a timing thing. Took a couple of days. They were counting but they didn’t appear in the drop down for 2 days after creation.

All good and working now, thanks.

Does this work in the same way for triple tariffs?

I’ve just switch to Octopus Flux, which has 3 import and 3 export tariffs.

I’ve created all the necessary utility meter helpers, it’s the switching automation I’m not sure about. Does the

option: "{{ tariff }}"

Cycle through the utility meter rates at the trigger time?

I’ve set it up like that so we’ll see what happens.

Should do (but I’ve not tried it).

Add a third time change in the Yaml matching the rate name in your utility meter and all should be well.

Let us know how it goes. Thanks

@P6Dave I’d be interested to know if you got this working and if so how you set it up. I’ve just switched today to Flux.

I did get it working, but it took a bit more work.

I created the usual helpers, one for import rates and one for export rates, with the tariffs I’m on. They look like this:

Then the following automation switches between them at the right times:

alias: "Octopus Flux Rates Switch for Utility Meter "
description: ""
trigger:
  - platform: time
    at: "02:00:00"
    variables:
      tariff: Off Peak
    id: Cheap Rate
  - platform: time
    at: "05:00:00"
    id: Standard Rate
  - platform: time
    at: "16:00:00"
    variables:
      tariff: Peak
    id: Peak Rate
  - platform: time
    at: "19:00:00"
    variables:
      tariff: Peak
    id: Standard Rate Again
condition: []
action:
  - choose:
      - conditions:
          - condition: trigger
            id: Cheap Rate
        sequence:
          - service: select.select_option
            data:
              option: Flux Cheap Import
            target:
              entity_id: select.octopus_flux_import_rate
          - service: select.select_option
            data:
              option: Flux Cheap Export Rate
            target:
              entity_id: select.octopus_flux_export_rates
      - conditions:
          - condition: trigger
            id: Standard Rate
        sequence:
          - service: select.select_option
            data:
              option: Flux Standard Import
            target:
              entity_id: select.octopus_flux_import_rate
          - service: select.select_option
            data:
              option: Flux Standard Export Rate
            target:
              entity_id: select.octopus_flux_export_rates
      - conditions:
          - condition: trigger
            id: Peak Rate
        sequence:
          - service: select.select_option
            data:
              option: Flux Peak Import
            target:
              entity_id: select.octopus_flux_import_rate
          - service: select.select_option
            data:
              option: Flux Peak Export Rate
            target:
              entity_id: select.octopus_flux_export_rates
      - conditions:
          - condition: trigger
            id: Standard Rate Again
        sequence:
          - service: select.select_option
            data:
              option: Flux Standard Import
            target:
              entity_id: select.octopus_flux_import_rate
          - service: select.select_option
            data:
              option: Flux Standard Export Rate
            target:
              entity_id: select.octopus_flux_export_rates
mode: single

I couldn’t get the option: "{{ tariff }}" to work with three rates.

I’ve also got a bunch of utility meter helpers counting up daily, weekly, monthly, yearly totals for each rate

Congrats on getting it going - all that YAML must have taken some persistence.

I really don’t know why the tariff variable approach didn’t work. Hate not knowing so I’ve created a test utility meter with three rates and this automation to control the selector

alias: Peak/Cheap rate select for three rate Utility meter
description: ""
trigger:
  - platform: time
    at: "02:00:00"
    variables:
      tariff: Cheap
  - platform: time
    at: "05:00:00"
    variables:
      tariff: Standard
  - platform: time
    at: "16:00:00"
    variables:
      tariff: Peak
  - platform: time
    at: "19:00:00"
    variables:
      tariff: Standard
action:
  - service: select.select_option
    target:
      entity_id: select.test_utility_meter
    data:
      option: "{{ tariff }}"
mode: single

Will leave it running for 24 hours and see how it goes

1 Like