I’m looking to pull in custom time frames and calculations on the on/off events of my underfloor heating switches.
So I have this panel with all the heating switches.
The idea is to extract the on/off times from the logbook and have them on another row plus calculations on cost kWh.
My panel looks like this now.
I’ve seen a couple of Gits with projects but would like to hear from people who have done something similar. How do I extract the data from the logbook easily?
I’m struggling quite a bit with this. Getting the hang of the node flow in node-red for automation.
But what I am really looking for is a way to code in sql to pull out total times of on/off states of specific entities (do some further calcs on them) and show them on the lovelace or even the node-red dash in a visible UI form.
I’ve added sqllite on the sidebar so I can query data but rendering this into lovelace is where I am stuck
ok my confusion continues.
Created a linear graph with just the sum temp sensor. All looked fine.
Published it to a new dash and just get one dot, not what I see in the query view.
Can anyone shed light on why 2 of the sensors are not feeding in data here for the past 3 hours but on the lovelace I can see the temp just fine? Also on my ewelink app.
Nothing excluded in the config yml. Can’t see any abnormal error logs.
If I change the option of fil to fill(previous) this then continues the lines.
Does this mean if there has been no change in value the linear graph stops unless I use previous option?
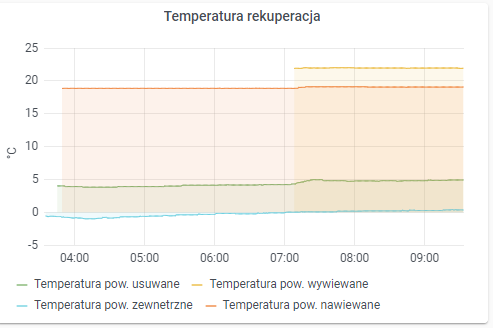
Hello @yonny24 did you solve this issue with missing records in grafana ? , I have exactly the same problem with my measurement of temperature in my HVAC system. Could not find anything to solve this.