I’m not sure if I am doing it the right way, but anyway it worked for me, so I just wanted to let you know that if you want to install new panels in Grafana, in a Hass.io environment , you have just to put the following code in the “Options” field.
This is for the clock panel
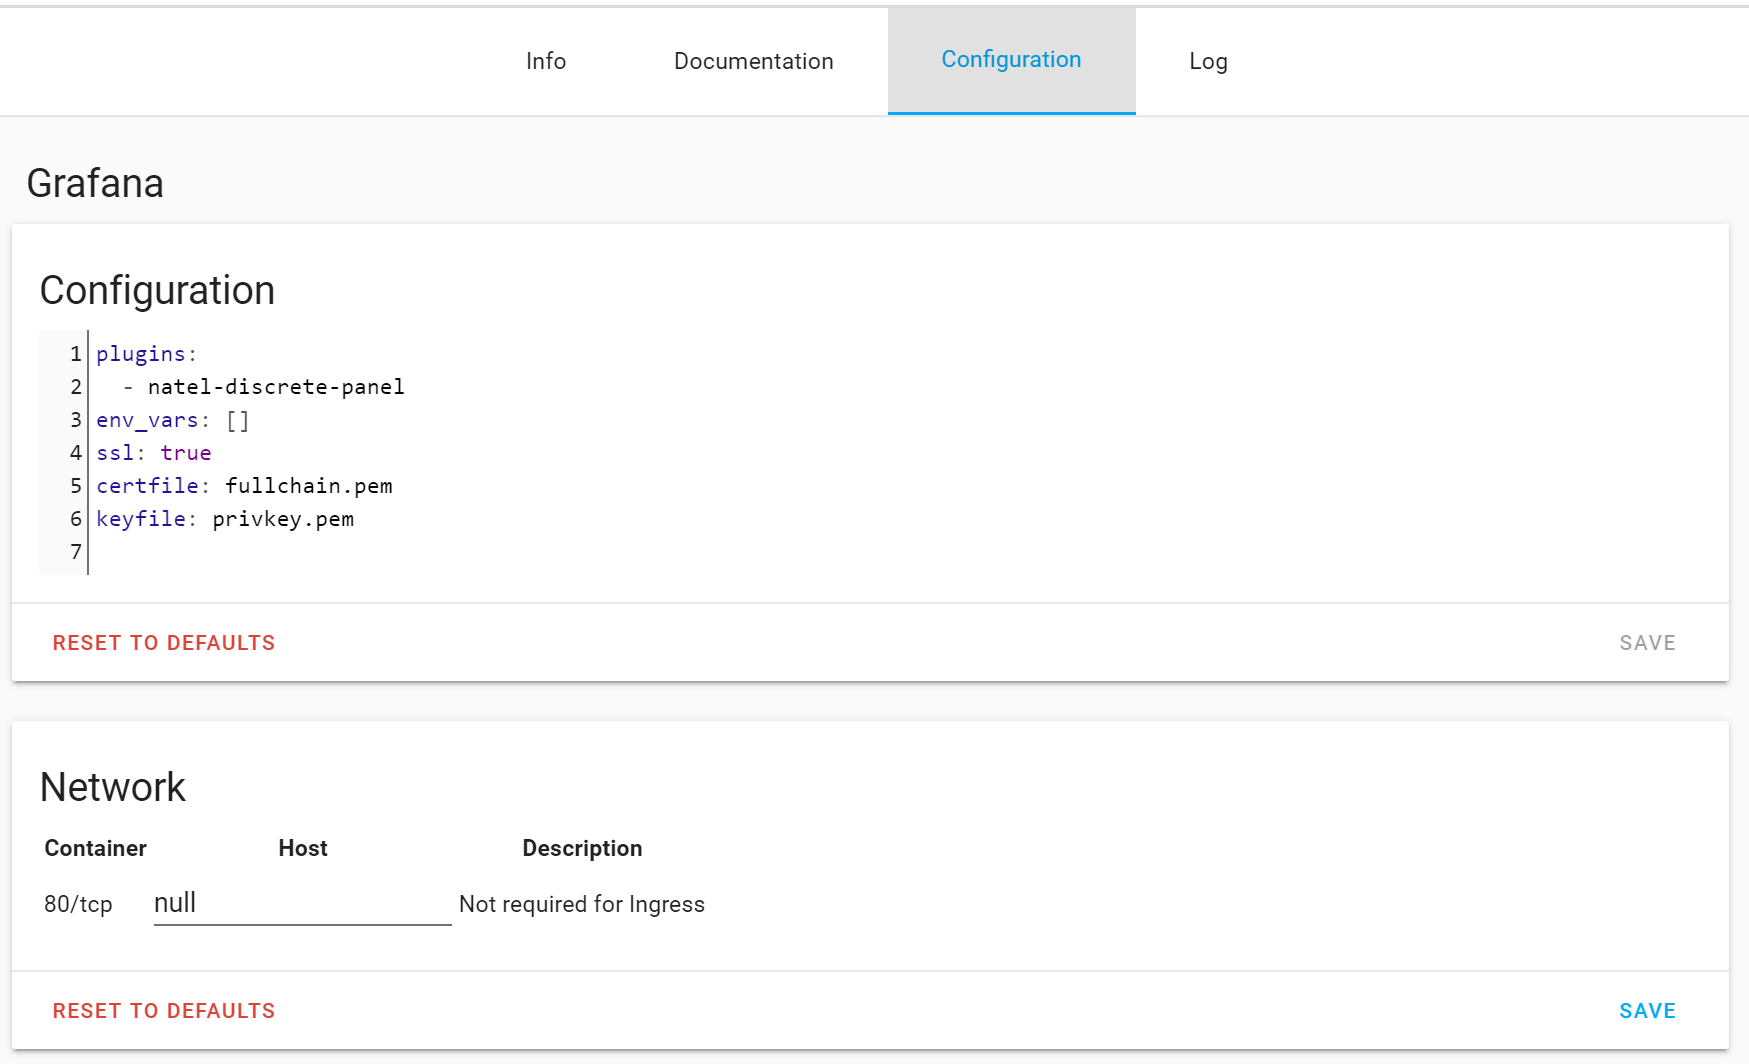
The plugin will be installed on restart. In Grafana you can then create a new datasource and select the new type that becomes available with the plugin.
As a note I went to Supervisor --> clicked on Grafana under add-ons —> clicked on Configuration —> that’s where you’re screenshot comes in. Thanks again.
Simply add the plugin: string to the config in home assistant
plugins": [
    "grafana-influxdb-flux-datasource"
Then you can find it in grafana, click and install. But my problem is now i can’t get configured ntopng plugin with pfsense ntopng? Are you planning also to do that?
Allright - thank you!
I switched to an opnsense firewall just some weeks ago but it should be indeed very similar for ntopng. I also found the site on github explaining how to connect to ntopng but haven’t messed - uhps - set this up yet.
I’ve managed to connect ntopng to influxdb though and all those multidirections and changes spin my head at the moment. I have to rest a little bit overthinking what would be possible and what desirable.
The ntopng-blog entry is some years old and I haven’t found this nice how-to until now on the web. So if you come across something like that - I would be interested.
Where do I find ID for plugin? I tried to install Grafana_Status_panel from https://github.com/Vonage/Grafana_Status_panel but it ends with error that plugin id cannot be found… I think the way which is described here only works for plugins that are in grafana “store”, not for those at github.