VagoHome
October 27, 2021, 9:22pm
1
Hi, I’m lost in trying to visualize the estimate natural gas used for house heating basing on the hystory_stats sensor shown down here.
 - platform: history_stats
    name: Riscaldamento living oggi
    entity_id: switch.termoliving
    state: on
    type: time
    start: '{{ now().replace(hour=0).replace(minute=0).replace(second=0) }}'
    end: '{{ now() }}'
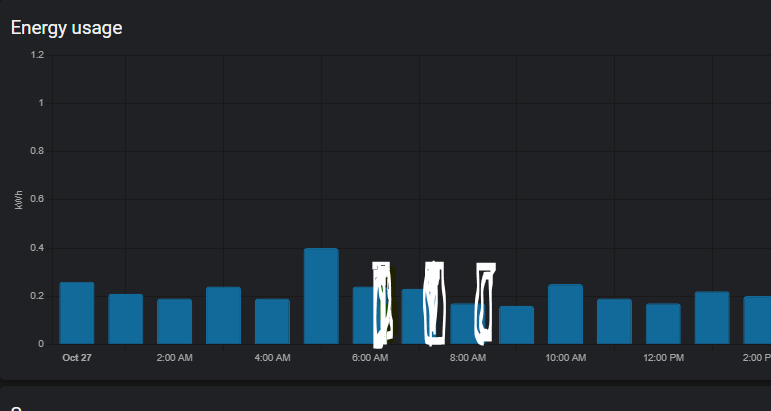
Here the history graph of the sensor
I tried to compute by hour but the sensor is not shown as eligible sensor for the energy page.
So, recap, how can show an hourly computed history stats into the energy monitor?
Try this custom component:
In the last few weeks I have been working on a custom component to get virtual power sensors for your lights or other devices. It is stable enough right now to share it on this forum and make dedicated topic for it.
The component provides multiple strategies to calculate estimated power consumption. One of the most interesting is the LUT method (using lookup tables). Some community members and me have taken measurements for all kind of different brightness/hue/saturation settings and their resp…
Should cover your needs without creating a history stats sensor.
VagoHome
November 28, 2021, 3:36pm
3
Thankyou, eventually I merged up all yours ideas and I managed in exstimate the cubic meters by invrementing a value by some logics via node red.
I measured the volume of gas used in one hour at different time during the day and so I derived a value ‘per 10 seconds’. So each ten seconds I push to home assistant the new calculated value.
In the first month I had a 12% delta, now, let check the next month.
Thankyou
Stefano