Last_seen state gets set to 'unknown' after restart of ZUI

I’m looking for help debugging this odd issue.

Running HAOS core 2025.12.2 and zui add-on 6.1.2 (zui 11.8.2/js 15.17.1)

(n.b. I know I can work around this with a template sensor)

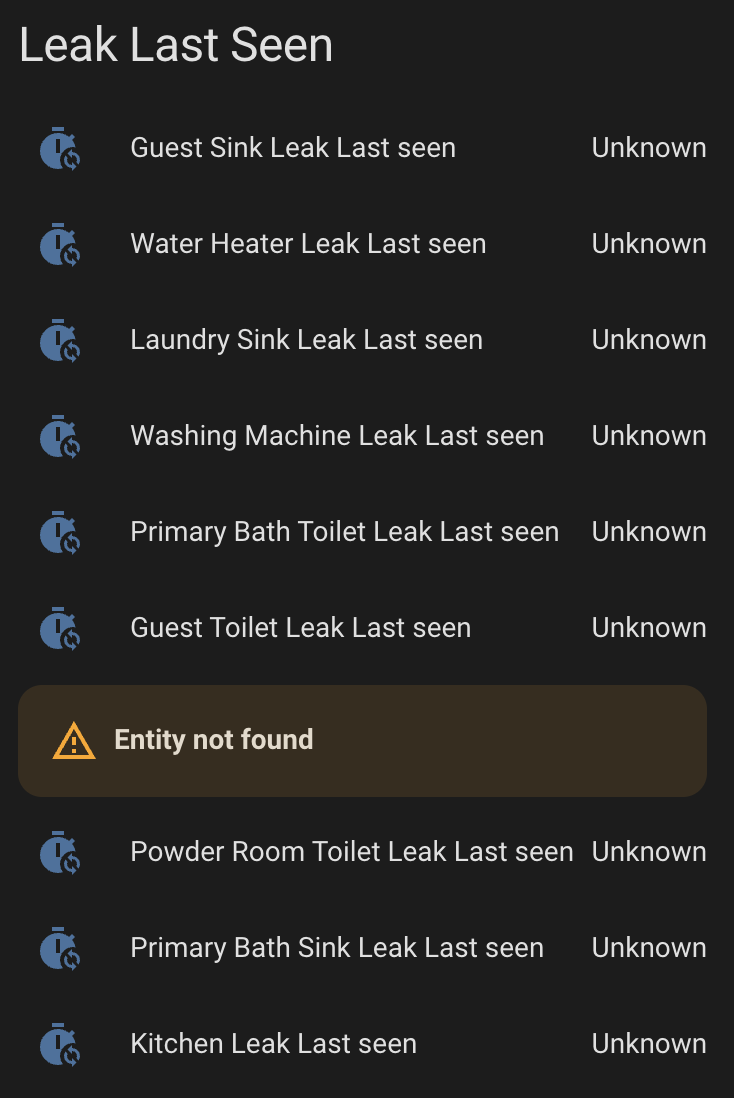
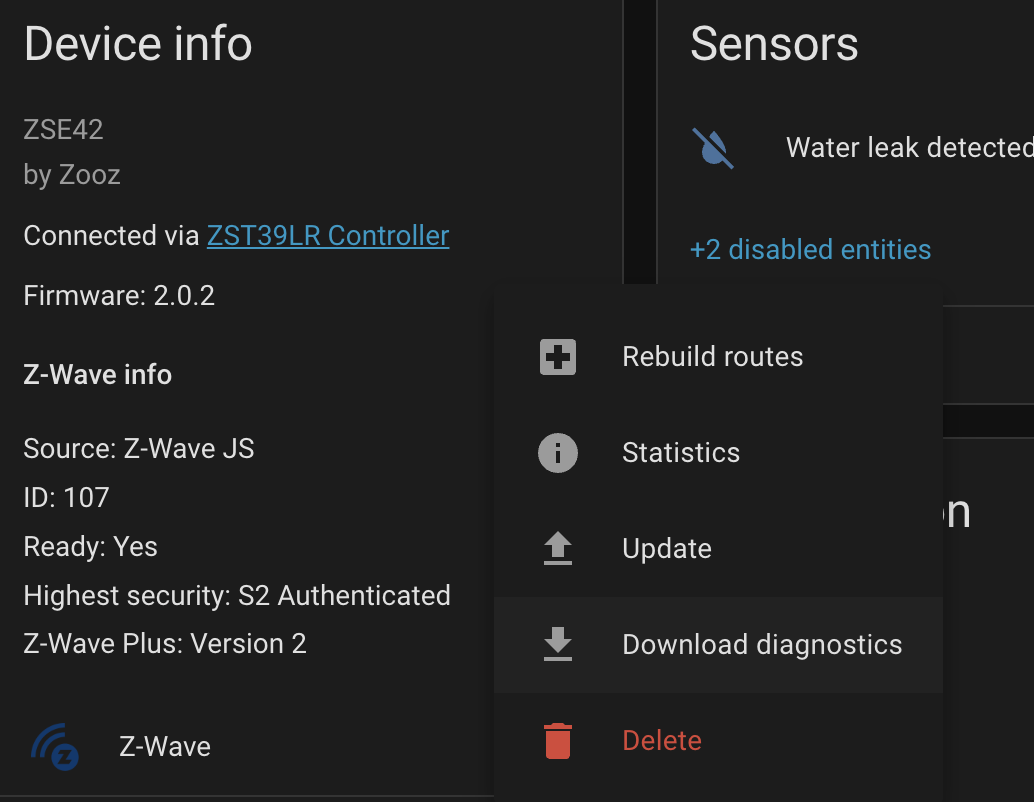
I have a bunch of Zooz ZSE42 leak sensors (battery, so mostly asleep). I have an automation that checks the last_seen times a few times a day to make sure that they are still waking up every so often (meaning they are not dead).

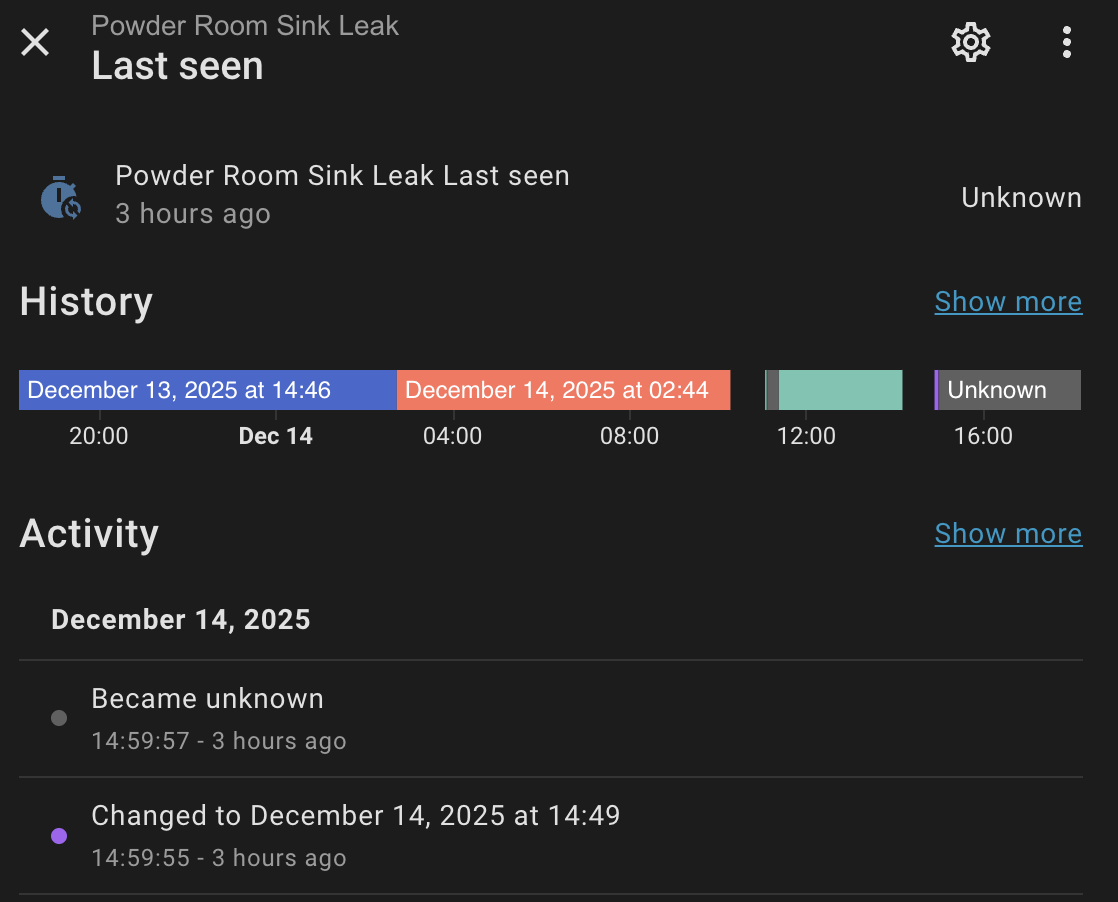
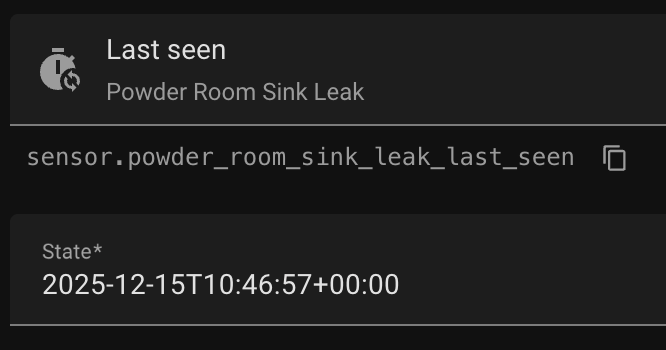
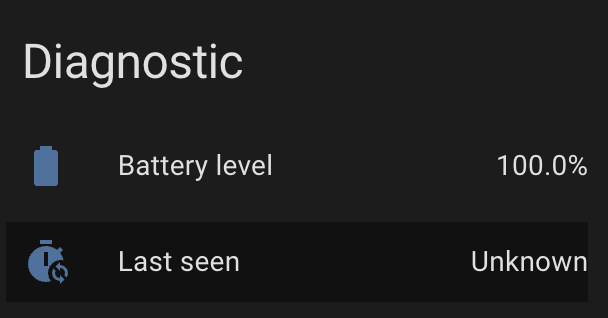
When I restart the zwave-js ui add-on (or update it) the last_seen times change to unknown. I thought that didn’t make sense – after all the last_seen time is still the same as it was before.

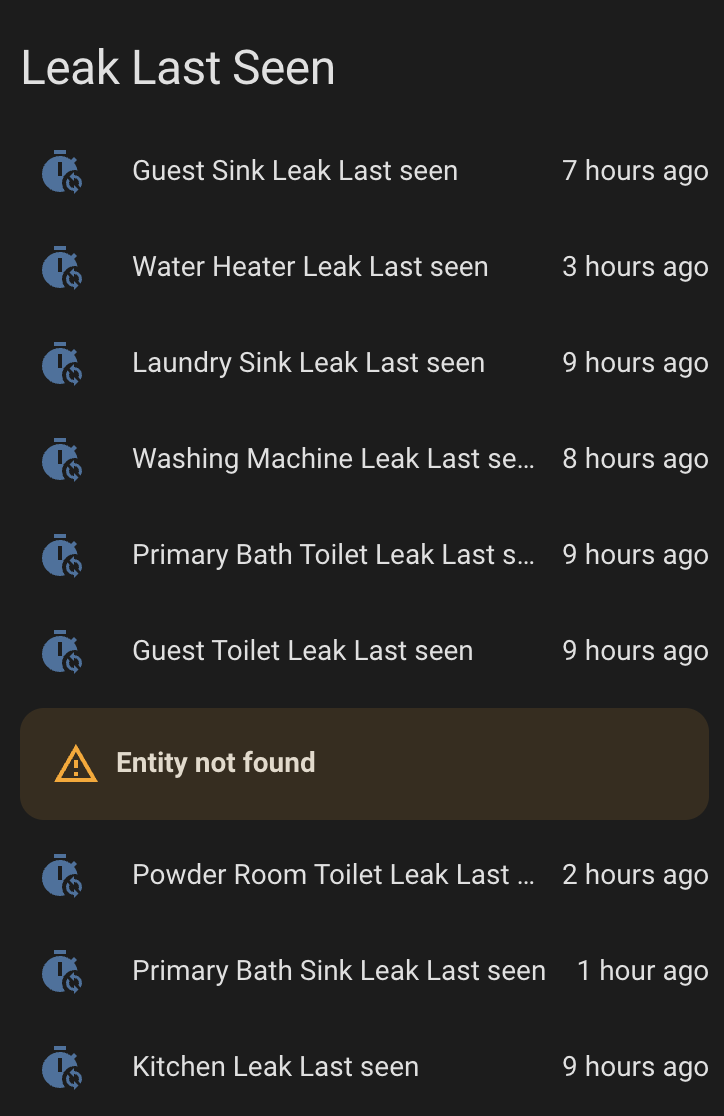
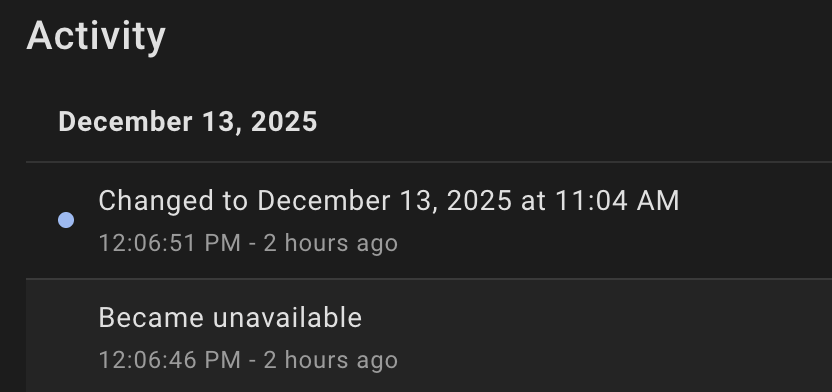
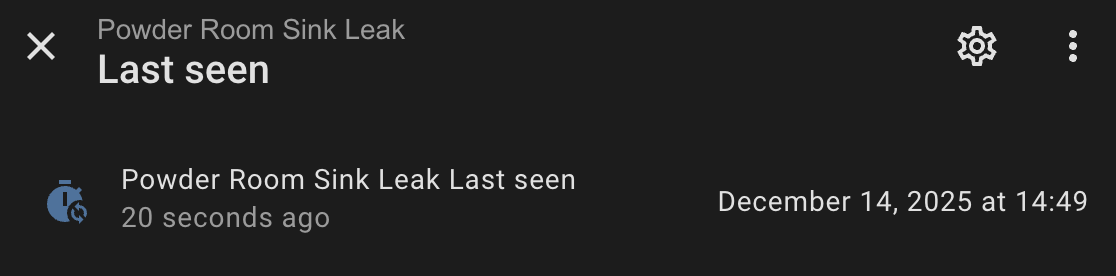
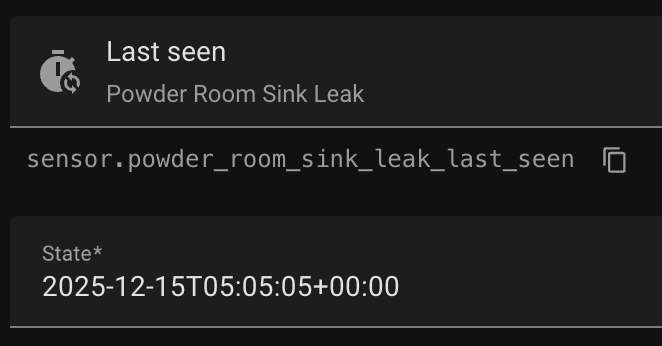
But, notice that when I restart zwave-js ui the last_seen time actually does come back but then it changes to unknown.

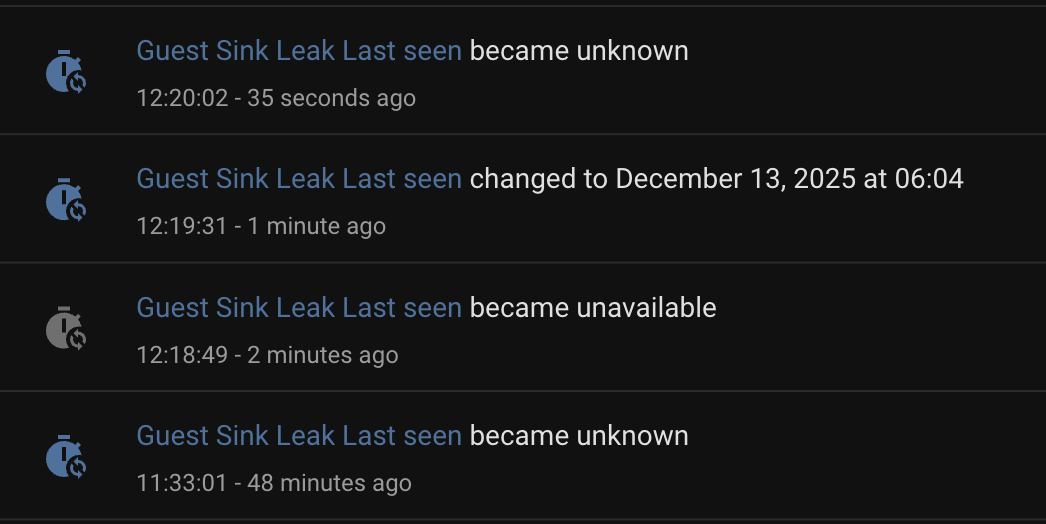
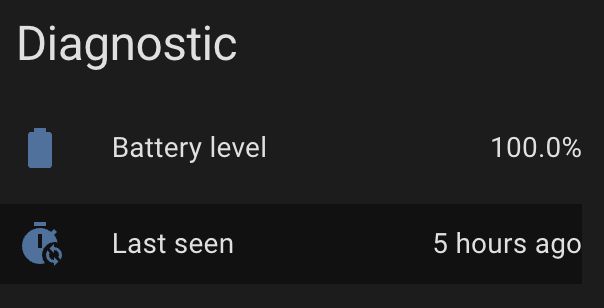
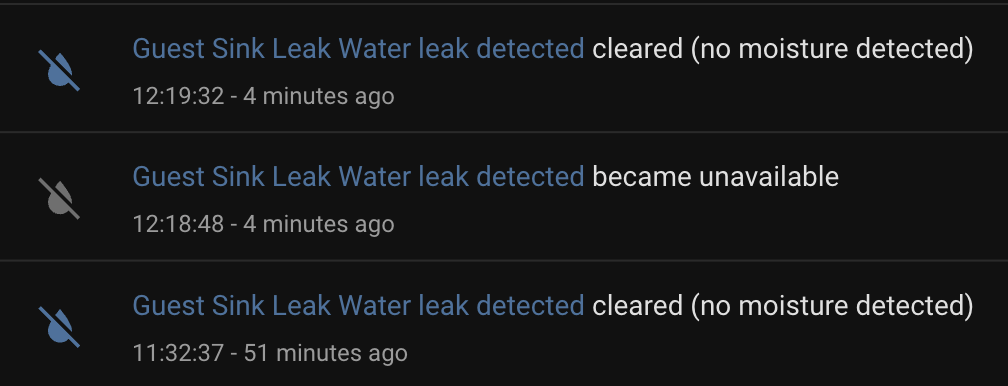
And to be clear, other states do come back:

Note: Restarting HA will bring back the old last_seen times.

Debugging:

I have too much activity on my HAOS system, so to debug this I started up a new instance of HA:stable and zwave-js ui:latest in docker

And now I a cannot reproduce. Restarting the zwave-js container and the last_seen times come back and it does NOT then change to unknown. (Of course it works fine there… :wink: )

Now what?

Back to HAOS production machine with zwave logging enabled.

That “Guest Sink” is node 52, so maybe the debug logs will help, but not seeing any lastSeen updates in the websocket messages:

$ fgrep WSMessage home-assistant_zwave_js_2025-12-13T20-20-08.405Z.log | grep lastSeen | wc -l
      71
$ fgrep WSMessage home-assistant_zwave_js_2025-12-13T20-20-08.405Z.log | grep lastSeen | grep '"nodeId":52' | wc -l
       0

There is a log entry for node 52 at 12:20:02 (when it changed to unknown, but doesn’t include any lastSeen updates.

$ fgrep -B 1 '"nodeId":52' home-assistant_zwave_js_2025-12-13T20-20-08.405Z.log | grep -C 1 12:20
--
2025-12-13 12:20:02.056 DEBUG (MainThread) [zwave_js_server] Received message:
WSMessage(type=<WSMsgType.TEXT: 1>, data='{"type":"event","event":{"source":"node","event":"statistics updated","nodeId":52,"statistics":{"commandsTX":0,"commandsRX":0,"commandsDroppedRX":0,"commandsDroppedTX":0,"timeoutResponse":0,"lwr":{"repeaters":[10],"protocolDataRate":2}}}}', extra='')

So, now what?

How can I debug this further? Is there a way to figure out what is making that state change to “unknown”?

Is last_seen just another entity that is set by zwave-js? That is HA should retain the state unless told otherwise?

See how it's happening to all of these devices

The entity not found is the one I moved over to my test HA/ZUI machine.

If I restart HA or if I reload the zwave-js integration everything comes back:

When the controlling application is no longer there, HA tells you it’s unknown. When the device checks in again, it is again known.
Always did that.

A better question is why are you restarting it?

BTW, Z2M, ZHA, Z-WaveJS, MQTT, and any other similar controller software will do the same.

I was not able to reproduce.

  1. Stop Z-Wave JS. All last_seen entities go unavailable, which is expected.
  2. Start Z-Wave JS. All last_seen entities are restored to their previous state, even battery devices.

I’m not sure what would set “Unknown”.

“last_seen” is not something Z-Wave JS knows about. HA updates it whenever any new statistic even is received for the node.

When zwave-js stops the entity reports being unavailable – if you look at that first image when it stops it becomes unavailable, and then restores the state then (30 seconds later) it becomes unknown. The devices are battery they are not going to “check in” again for many hours.

It does not do that on a fresh install of zui and ha:

I was wondering about that. Isn’t this a dump of what zui sent over the websocket?
There’s a lastSeen in there:

2025-12-13 12:20:04.847 DEBUG (MainThread) [zwave_js_server] Received message:
WSMessage(type=<WSMsgType.TEXT: 1>, data='{"type":"event","event":{"source":"node","event":"statistics updated","nodeId":75,"statistics":{"commandsTX":6,"commandsRX":5,"commandsDroppedRX":0,"commandsDroppedTX":0,"timeoutResponse":0,"rtt":60,"lastSeen":"2025-12-13T20:20:04.642Z","rssi":-87,"lwr":{"protocolDataRate":3,"repeaters":[10],"rssi":-88,"repeaterRSSI":[-86]}}}}', extra='')

Or is the integration injecting that?

Yeah, like you, when I tested on my test machine I don’t see the same behavior. Probably need to figure out how to trace what is making that state update. It’s 30 seconds after the state came back.

BTW – thank you for testing. I know it takes time.

Adding:

One other issue is I’m not really running the same docker images.

On my “production” machine it’s running:

zwave-js-ui: 11.8.2
zwave-js: 15.17.1

And on my test machine (which is an old Macbook Pro running Ubuntu:

zwave-js-ui: 11.8.2.a4e8747
zwave-js: 15.17.1
with docker-compose.yaml:

  • image: homeassistant/home-assistant:stable
  • image: zwavejs/zwave-js-ui:latest

Both machines are each connected to ZST39 LR via usb.

On the Rpi:

➜  ~ docker inspect -f '{{.Image}}' addon_a0d7b954_zwavejs2mqtt
sha256:464f9c698f388dc5ea0b7265701104a53806bd968078d2ebe29e219eee2dcb9f

And on the Ubuntu machine:

~$ docker inspect -f '{{.Image}}' zwave-js-ui
sha256:0cb671d14e9171b43d6334c3f5c812143cb4b716bc1f62a489a3931ca1b10a12

Maybe I need to get another Pi running to test the same code.

Ok, my guess is this is an issue in the integration.

Perhaps a timeout in the integration related to the number of devices I have or the volume of traffic on that controller. Does not happen on other hubs on the same machine or on any other test environment I tried.

Indeed, it’s also the only hub where I have problems including my test sensor and have to re-interview (or exclude and include again).

2025-12-14 10:57:14.457 CNTRLR   Received Smart Start inclusion request (Z-Wave Long Range)
2025-12-14 10:57:14.459 CNTRLR   Controller is busy and cannot handle this inclusion request right now...

The Last Seen entities are (typically?) disabled by default. So, probably not many people would notice. And it’s only the battery devices – the powered devices report frequently enough to update.

My work-around is to reload the hub’s config-entry when I see a battery device listed as ‘unknown’.

Notes and details

The issue:

Again, when ZUI restarts all the entities become unavailable (as expected), then the last_seen entities will restore their values briefly, and then they all turn to unknown. But, that only happens on one of my zwave config-entires.

Testing:

I have three z-wave “hubs” configured on my production instance of HA.

  1. my main controller, a ZST39 LR with about 80+ devices.
  2. TubesZW (serial over IP)
  3. A Raspberry Pi 3b running ZUI in docker.

Both of last two only have five or six devices each.

The issue only happens on the hub with 80 or so devices.

I also tried with a fresh install on a Rpi4 and on Ubuntu, but all works fine.

The main ZST39 hub is also is the only place where including a battery device doesn’t fully interview. Granted the ZST39 hub has quite a bit more devices on it, but I am seeing some frequent errors:

Happening to a bunch of nodes, not sure any are battery:

root@a0d7b954-zwavejs2mqtt:/data/store/logs$ fgrep -A 1 'Dropping message with invalid payload'  zwavejs_current.log | grep Node | cut -d '[' -f 2 | sort -r -t ' ' -k 2 | uniq -c | sort -nr
     73 Node 099]
     55 Node 046]
     52 Node 048]
     15 Node 075]
     14 Node 080]
     14 Node 076]
     13 Node 049]
     13 Node 036]
     12 Node 107]
     11 Node 106]
     11 Node 082]
      9 Node 086]
      8 Node 087]
      8 Node 020]
      7 Node 085]
      6 Node 090]
      6 Node 034]
      6 Node 024]
      5 Node 081]
      3 Node 010]
      2 Node 104]
      2 Node 001]
      1 Node 043]

Yes, you’re right, my earlier message was not accurate. HA is populating its sensor state based on that value from the message.

Is it possible you are seeing some statistics events which are missing the lastSeen field?

Here’s another thing to check, download the Device Diagnostic from the device page. What values are shown for lastSeen? Are any of them empty or missing or some other value that’s not a time? Example:

...
      "statistics": {
        "commandsTX": 10,
        "commandsRX": 9,
        "commandsDroppedRX": 0,
        "commandsDroppedTX": 0,
        "timeoutResponse": 0,
        "rtt": 38,
        "lastSeen": "2025-12-14T21:34:32.066Z",
        "rssi": -74,
        "lwr": {
          "protocolDataRate": 3,
          "repeaters": [],
          "rssi": -73,
          "repeaterRSSI": []
        }
      },
      "highestSecurityClass": 1,
      "isControllerNode": false,
      "keepAwake": false,
      "lastSeen": "2025-12-13T21:32:24.891Z",
...

That’s a great idea. So, the diagnostics should be the last update from zwave-js?

This sensor’s last_seen is currently ‘unknown’:

The diags from here have this:

$ jq . 'zwave_js-f890ca897acc7ae3dcf39ceca9103a35-Powder Room Sink Leak-75d18ec1e8d37cfd6a30eb2509abf23d.json' | grep lastSeen
      "lastSeen": "2025-12-14T22:49:29.586Z",

That matches up with the full diags from here:

And that file includes this (node 107 is the device from the image above):

            "nodes": [
              {
              ....
              {
                "nodeId": 107,
                "index": 0,
                "installerIcon": 3077,
                ...
                "highestSecurityClass": 1,
                "isControllerNode": false,
                "keepAwake": false,
                "lastSeen": "2025-12-14T22:49:29.586Z",
                "protocol": 0,
                "sdkVersion": "7.19.3"
              }

And then when I reload that hub (config-entry) I get back that same time:

Seems like it’s the integration.

Last night I tried to see if there were any events in the database that lead to the unknown state, but I could not find any event tied to the state table row.

Well, how about turning on the integration debug log and seeing what it says during startup. Maybe the lastSeen comes in too late?

It loads the node one during startup.

Here’s another way to check, if you can access the driver cache files (Store directory), are all of the lastSeen values persisted in the DB?

$ rg lastSeen
d73ecdff.jsonl
165:{"k":"node.2.lastSeen","v":1765770174351}
166:{"k":"node.14.lastSeen","v":1765769852071}
167:{"k":"node.15.lastSeen","v":1765661545236}
...

I did that once and didn’t see anything, but will try again. There’s a lot of data sent when the container is restarted.

Not exactly following you here, but I don’t think it’s too late, but I’m not sure how the parts work. Again, when I restart the zwave-js container it first goes unavailable then it flashes briefly the correct last seen times. Then it changes to unknown.

Is that brief update of the correct timestamps coming from zwave-js (over the websocket, of course), or is it a saved state in HA?

Do you have any wild guesses why it’s only happening on that one hub (config-entry)? The main difference is that it has most of the devices on it.

When the integration connects to Z-Wave JS it receives the entire node state as part of the startup sequence. That is how the lastSeen property is initialized. If the property does not exist on the node, I think it will cause the entity to be Unknown (value None). In the future, the value is received from the statistics even whenever the node communicates.

The correct last time seen initially is probably the restored entity state, then it gets overwritten as None during startup if lastSeen is missing from the node. That’s a theory at least.

The diagnostic dump makes a new connection to the websocket server and will have more recent state than during startup, so it’s possible the lastSeen was added later.

Turning on the integration debug logging and restart the integration will show what data HA receives during startup. Yes, it’s large because it’s the full node state, just like in the diagnostic. If the node’s lastSeen property is missing from the node state during startup, it’s a problem in Z-Wave JS then. If the value exists, it’s a problem in HA.

So restarting the integration is similar to restarting the zwave-js container. In both cases the websocket is reconnected and there’s a huge dump of data.

When I restart the zwave container it seems like the entities immediately change to unavailable. Then it takes a while before the timestamps appear briefly. With logging enabled it takes quite a bit more time!

I just did a restart and got about 17k lines of logs. It’s really hard to dig though.

But, I did a download of diagnostics again and grabbed the lastSeen timestamp. Then I grepped the HA log and that timestamp was in there.

It might be better for me to try and hack the integration and look for updates to a specific nodeId and then print the message – or print it if it has a lastSeen key.

Thanks again for your help.

To follow up on that, if I restart the zwave-js container and the state ends up as “unknown”, but I see the lastSeen timestamp in the logs then it means it’s HA, not z-wave js. I think I saw that, but will verify tomorrow.

Obviously, restarting the zwave-js container is going to kill the integration’s websocket and force the integration to restart. Any idea how that forced restart might be different than running restart from the integration page? That restart always picks up the timestamp.

If you restart Z-Wave JS, the in-memory state is lost and on restart it will load data from its cache. If you restart the integration, everything is already available, the driver just sends what it knows about.

Here’s a quick method I came up with to extract the node state and print last seen:

❯ grep '"messageId":"start-listening"' home-assistant_zwave_js_2025-12-15T06-13-04.375Z.log | sed -nE 's/^WSMessage\(.*data=\'(.*)\', extra.*\)/\1/p' | sed 's/\\\\"/\\"/g' | jq '.result.state.nodes[] | {"nodeId": .nodeId, "nodeLastSeen": .lastSeen, "statsLastSeen": .statistics.lastSeen}' -c
{"nodeId":1,"nodeLastSeen":null,"statsLastSeen":null}
{"nodeId":2,"nodeLastSeen":"2025-12-15T06:04:11.920Z","statsLastSeen":"2025-12-15T06:04:11.920Z"}
{"nodeId":9,"nodeLastSeen":"2025-08-12T05:57:39.469Z","statsLastSeen":null}
{"nodeId":11,"nodeLastSeen":"2025-12-15T05:38:11.026Z","statsLastSeen":"2025-12-15T05:38:11.026Z"}
{"nodeId":12,"nodeLastSeen":"2025-12-15T05:43:40.056Z","statsLastSeen":"2025-12-15T05:43:40.056Z"}
...

That was after restarting the integration.

Here’s the same thing when restarting Z-Wave JS:

❯ grep '"messageId":"start-listening"' home-assistant_zwave_js_2025-12-15T06-56-42.096Z.log | sed -nE 's/^WSMessage\(.*data=\'(.*)\', extra.*\)/\1/p' | sed 's/\\\\"/\\"/g' | jq '.result.state.nodes[] | {"nodeId": .nodeId, "nodeLastSeen": .lastSeen, "statsLastSeen": .statistics.lastSeen}' -c
{"nodeId":1,"nodeLastSeen":null,"statsLastSeen":null}
{"nodeId":2,"nodeLastSeen":"2025-12-15T06:56:17.854Z","statsLastSeen":"2025-12-15T06:56:17.854Z"}
{"nodeId":9,"nodeLastSeen":"2025-08-12T05:57:39.469Z","statsLastSeen":null}
{"nodeId":11,"nodeLastSeen":"2025-12-15T06:37:35.891Z","statsLastSeen":null}
{"nodeId":12,"nodeLastSeen":"2025-12-15T06:48:11.131Z","statsLastSeen":null}
{"nodeId":13,"nodeLastSeen":"2025-12-15T06:56:04.672Z","statsLastSeen":null}
{"nodeId":14,"nodeLastSeen":"2025-12-15T06:56:17.519Z","statsLastSeen":"2025-12-15T06:56:17.519Z"}
...

Notice the null lastSeen from the statistics, those are battery devices. HA will fill in the last seen from the node field as a default if the statistic is not available, then update it whenever the battery devices communicate again. Z-Wave JS does a quick ping on startup for powered nodes, so those have statistics already.

So if both values happened to be missing, I could see that resulting in “Unknown”. But if you are seeing the node’s last seen in the listening message, then it shouldn’t be unknown in HA.

That thins the logs out. Thanks.

I don’t download the logs from the integration – I get too big of a file, so this is on my HAOS machine.

Before I restart:

➜  ~ date
Mon Dec 15 07:33:41 PST 2025
➜  ~ date -u
Mon Dec 15 15:33:45 UTC 2025

Now I enable logging, restart the config-entry, and then stop logging and save the last few minutes of the logs:

➜  ~ date
Mon Dec 15 07:34:34 PST 2025
➜  ~ docker logs --since 2m homeassistant 2>> log
➜  ~ grep '"messageId":"start-listening"' log | sed -nE "s/^WSMessage\(.*data='(.*)', extra.*\)/\1/p" | sed "s/\\\\'/'/g" | sed 's/\\\\"/\\"/g' | jq -c '.result.state.nodes[] | {"nodeId": .nodeId, "nodeLastSeen": .lastSeen, "statsLastSeen": .statistics.lastSeen}' | tail -10


{"nodeId":88,"nodeLastSeen":"2025-12-15T04:17:47.982Z","statsLastSeen":"2025-12-15T04:17:47.982Z"}
{"nodeId":89,"nodeLastSeen":"2025-12-15T04:17:47.792Z","statsLastSeen":"2025-12-15T04:17:47.792Z"}
{"nodeId":90,"nodeLastSeen":"2025-12-15T09:32:26.738Z","statsLastSeen":"2025-12-15T09:32:26.738Z"}
{"nodeId":91,"nodeLastSeen":"2025-12-15T10:01:13.191Z","statsLastSeen":"2025-12-15T10:01:13.191Z"}
{"nodeId":94,"nodeLastSeen":"2025-12-15T04:17:47.044Z","statsLastSeen":"2025-12-15T04:17:47.044Z"}
{"nodeId":96,"nodeLastSeen":"2025-12-15T15:28:04.395Z","statsLastSeen":"2025-12-15T15:28:04.395Z"}
{"nodeId":97,"nodeLastSeen":"2025-12-15T11:46:42.227Z","statsLastSeen":"2025-12-15T11:46:42.227Z"}
{"nodeId":99,"nodeLastSeen":"2025-12-15T15:33:18.064Z","statsLastSeen":"2025-12-15T15:33:18.064Z"}
{"nodeId":100,"nodeLastSeen":"2025-12-15T02:01:58.130Z","statsLastSeen":null}
{"nodeId":107,"nodeLastSeen":"2025-12-15T10:46:57.708Z","statsLastSeen":"2025-12-15T10:46:57.708Z"}

That node #107 is that battery device (zooz leak sensor) that I have bee using to look at. It last was was seen at 10:46Z, so about 5 hours ago.

And indeed, the activity says the same thing for the Node Status:

Ok, so now restart the zwave-js container. I’ll wait until HA reports ‘unknown’ before running the jq query.

With debug logs enabled it takes a while for the last seen entity to become “unknown”:

➜  ~ date && date -u
Mon Dec 15 07:47:06 PST 2025
Mon Dec 15 15:47:06 UTC 2025
➜  ~ docker restart addon_a0d7b954_zwavejs2mqtt
addon_a0d7b954_zwavejs2mqtt
➜  ~ date && date -u
Mon Dec 15 07:48:45 PST 2025
Mon Dec 15 15:48:45 UTC 2025
➜  ~ docker logs --since 3m homeassistant 2>> log
➜  ~ grep '"messageId":"start-listening"' log | sed -nE "s/^WSMessage\(.*data='(.*)', extra.*\)/\1/p" | sed "s/\\\\'/'/g" | sed 's/\\\\"/\\"/g' | jq -c '.result.state.nodes[] | {"nodeId": .nodeId, "nodeLastSeen": .lastSeen, "statsLastSeen": .statistics.lastSeen}' | tail -10


{"nodeId":88,"nodeLastSeen":"2025-12-15T15:47:57.995Z","statsLastSeen":"2025-12-15T15:47:57.995Z"}
{"nodeId":89,"nodeLastSeen":"2025-12-15T15:47:57.883Z","statsLastSeen":"2025-12-15T15:47:57.883Z"}
{"nodeId":90,"nodeLastSeen":"2025-12-15T09:32:26.738Z","statsLastSeen":null}
{"nodeId":91,"nodeLastSeen":"2025-12-15T10:01:13.191Z","statsLastSeen":null}
{"nodeId":94,"nodeLastSeen":"2025-12-15T15:47:57.524Z","statsLastSeen":"2025-12-15T15:47:57.524Z"}
{"nodeId":96,"nodeLastSeen":"2025-12-15T15:28:04.395Z","statsLastSeen":null}
{"nodeId":97,"nodeLastSeen":"2025-12-15T11:46:42.227Z","statsLastSeen":null}
{"nodeId":99,"nodeLastSeen":"2025-12-15T15:44:39.383Z","statsLastSeen":null}
{"nodeId":100,"nodeLastSeen":"2025-12-15T02:01:58.130Z","statsLastSeen":null}
{"nodeId":107,"nodeLastSeen":"2025-12-15T10:46:57.708Z","statsLastSeen":null}

So, this supports that the integration is doing something odd, right?

And this next part is revealing:

Starting with everything reporting correctly.

Here’s the current state, which matches the expected time:

I manually change the state to about 5 hours earlier:

And indeed, the date is now showing 11 hours ago:

Now I restart the container and it briefly flashes five hours ago (not 11!).

That means the integration is reading the updated timestamp from zwave. That is, it is not fetching (briefly) the state from a HA-saved state. It must be coming from what zwave sent after reconnecting the websocket.

Then in a few seconds it changes to “unknown”

Yeah, it’s looking like an issue with HA so far, because I am mostly out of ideas.

I double checked and I don’t think Z-Wave sensors are actually implemented as a “restore sensor”, so the initial state is always read from the node dump as you’ve suggested.

One more thing to check, make sure there’s no invalid statistics message with a missing lastSeen for the node. Since these look like battery devices, I doubt there is any message at all though.

❯ grep '"source.*node.*statistics updated"' home-assistant_zwave_js_2025-12-15T06-56-42.096Z.log | sed -nE 's/^WSMessage\(.*data=\'(.*)\', extra.*\)/\1/p' | sed 's/\\\\"/\\"/g' | jq '{"nodeId": .event.nodeId, "lastSeen": .event.statistics.lastSeen}' -c
{"nodeId":69,"lastSeen":"2025-12-15T06:56:02.578Z"}
{"nodeId":69,"lastSeen":"2025-12-15T06:56:03.106Z"}
{"nodeId":13,"lastSeen":"2025-12-15T06:56:04.307Z"}
{"nodeId":13,"lastSeen":"2025-12-15T06:56:04.375Z"}
{"nodeId":13,"lastSeen":"2025-12-15T06:56:04.672Z"}

My shell doesn’t like your command, so I modified, but I’m not seeing the same thing:

➜  ~ grep '"messageId":"start-listening"' log | sed -nE 's/^WSMessage\(.*data=\'(.*)\', extra.*\)/\1/p' | sed 's/\\\\"/\\"/g' | jq '{"nodeId": .event.nodeId, "lastSeen": .event.statistics.lastSeen}' -c
pipe quote>

➜  ~ grep '"messageId":"start-listening"' log | sed -nE "s/^WSMessage\(.*data='(.*)', extra.*\)/\1/p" | sed "s/\\\\'/'/g" | sed 's/\\\\"/\\"/g' | jq '{"nodeId": .event.nodeId, "lastSeen": .event.statistics.lastSeen}' -c
{"nodeId":null,"lastSeen":null}

I apologize for not knowing the code. It would be a lot more efficient if I could go in and hack the integration and see where the state might be updating to ‘unknown’.

It’s more frustrating that I cannot pull one of these sensors out into a test zui/ha instance and work there. I assume all the “hubs” are using the same integration code, so that makes me wonder if it isn’t a timeout, due to the volume of nodes, that is causing the integration to give up and set the state to unknown.

The integration is updating the state correctly then later changing it – which seems like it timed out and assumed the state was unknown. All a wild guess, of course.

Thanks again.