Hello all,
I used the morning to generate more local data for my dashboard. Through the tip of hsch0 I came across the data of the water level of the Rhine. Conveniently, the “Wasserstraßen- und Schifffahrtsverwaltung des Bundes” also offers a nice API with JSON output 
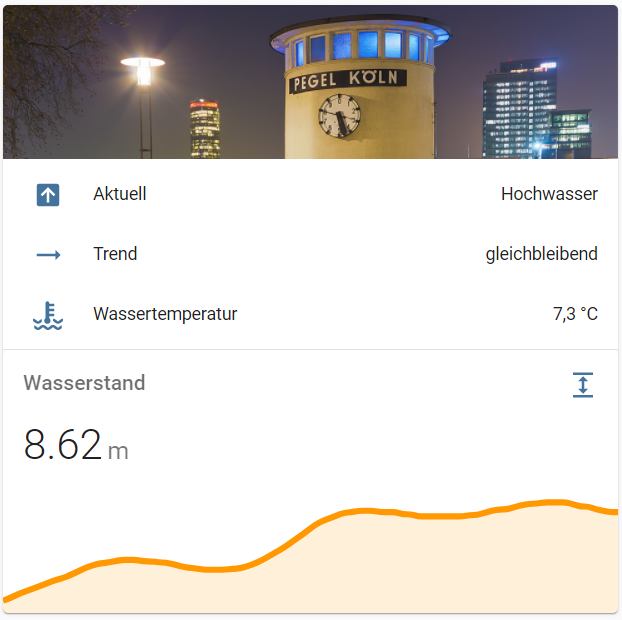
I have not yet worked up all the data in my Lovelace card and am always happy to receive tips and suggestions for improvement.
With the data, notifications about high and low water are of course also very feasible 
Dataset:
Helpful Tools:
- JSONPath Online Evaluator: https://jsonpath.com/
- JSON-Selector: http://jsonselector.com/
Parse RESTful JSON-Data:
sensor:
  - platform: rest
    name: "Pegel Cologne Wasserstand"
    resource: https://www.pegelonline.wsv.de/webservices/rest-api/v2/stations/K%C3%96LN.json?includeTimeseries=true&includeCurrentMeasurement=true
    json_attributes_path: $.timeseries[0].currentMeasurement
    json_attributes:
      - timestamp
      - trend
      - stateMnwMhw
      - stateNswHsw
    value_template: '{{ ( value_json.timeseries[0].currentMeasurement.value | int / 100 ) }}'
    unit_of_measurement: "m"

  - platform: rest
    name: "Pegel Cologne Abfluss"
    resource: https://www.pegelonline.wsv.de/webservices/rest-api/v2/stations/K%C3%96LN.json?includeTimeseries=true&includeCurrentMeasurement=true
    json_attributes_path: $.timeseries[1].currentMeasurement
    json_attributes:
      - timestamp
    value_template: '{{ value_json.timeseries[1].currentMeasurement.value }}'
    unit_of_measurement: "m³/s"

  - platform: rest
    name: "Pegel Cologne Temperatur"
    resource: https://www.pegelonline.wsv.de/webservices/rest-api/v2/stations/K%C3%96LN.json?includeTimeseries=true&includeCurrentMeasurement=true
    json_attributes_path: $.timeseries[2].currentMeasurement
    json_attributes:
      - timestamp
    value_template: '{{ value_json.timeseries[2].currentMeasurement.value }}'
    unit_of_measurement: "°C"
Generating some more Sensors from the data:
sensors:
  - platform: template
    sensors:
      pegel_cologne_wasserstand_trend:
        friendly_name: "Trend"
        value_template: >-
          {% if states.sensor.pegel_cologne_wasserstand.attributes.trend == 1 %}steigend
          {% elif states.sensor.pegel_cologne_wasserstand.attributes.trend == 0 %}gleichbleibend
          {% elif states.sensor.pegel_cologne_wasserstand.attributes.trend == -1 %}fallend
          {% else %}unbekannt{% endif %}
        icon_template: >-
          {% if states.sensor.pegel_cologne_wasserstand.attributes.trend == 1 %}mdi:trending-up
          {% elif states.sensor.pegel_cologne_wasserstand.attributes.trend == 0 %}mdi:trending-neutral
          {% elif states.sensor.pegel_cologne_wasserstand.attributes.trend == -1 %}mdi:trending-down
          {% else %}mdi:water{% endif %}

      pegel_cologne_wasserstand_state:
        friendly_name: "Aktuell"
        value_template: >-
          {% if states.sensor.pegel_cologne_wasserstand.attributes.stateMnwMhw == 'low' %}Niedrigwasser
          {% elif states.sensor.pegel_cologne_wasserstand.attributes.stateMnwMhw == 'normal' %}Normal
          {% elif states.sensor.pegel_cologne_wasserstand.attributes.stateMnwMhw == 'high' %}Hochwasser
          {% else %}unbekannt{% endif %}
        icon_template: >-
          {% if states.sensor.pegel_cologne_wasserstand.attributes.stateMnwMhw == 'low' %}mdi:down-up-box
          {% elif states.sensor.pegel_cologne_wasserstand.attributes.stateMnwMhw == 'normal' %}mdi:arrow-right-box
          {% elif states.sensor.pegel_cologne_wasserstand.attributes.stateMnwMhw == 'high' %}mdi:arrow-up-box
          {% else %}mdi:water{% endif %}

      pegel_cologne_wasserstand_schiffahrt:
        friendly_name: "Schiffahrt"
        value_template: >-
          {% if states.sensor.pegel_cologne_wasserstand.attributes.stateNswHsw == 'low' %}Zu wenig Wasser
          {% elif states.sensor.pegel_cologne_wasserstand.attributes.stateNswHsw == 'normal' %}Normal
          {% elif states.sensor.pegel_cologne_wasserstand.attributes.stateNswHsw == 'high' %}Zu viel Wasser
          {% else %}unbekannt{% endif %}
        icon_template: mdi:ferry

homeassistant:
  customize:
    sensor.pegel_cologne_wasserstand:
      friendly_name: Wasserstand
      icon: mdi:arrow-expand-vertical
    sensor.pegel_cologne_abfluss:
      friendly_name: Abfluss
      icon: mdi:water
    sensor.pegel_cologne_temperatur:
      friendly_name: Wassertemperatur
      icon: mdi:coolant-temperature
Lovelace-Code
type: vertical-stack
cards:
  - type: entities
    entities:
      - entity: sensor.pegel_cologne_wasserstand_state
      - entity: sensor.pegel_cologne_wasserstand_trend
      - entity: sensor.pegel_cologne_temperatur
    header:
      type: picture
      image: local/img/header_pegel.png
      tap_action:
        action: none
      hold_action:
        action: none
  - entities:
      - sensor.pegel_cologne_wasserstand
    hour24: true
    name: Wasserstand
    type: 'custom:mini-graph-card'
    hours_to_show: 168
    points_per_hour: 0.5
Lovelace-Card
Have fun!
