Hi
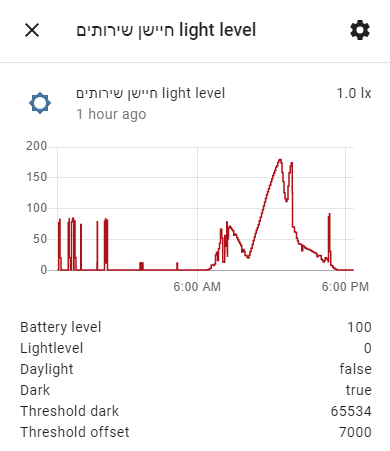
Is there a way to pull out the light level information (which can be presented in a form of a chart in the dashboard) as a table with timestamps?
Hi
Is there a way to pull out the light level information (which can be presented in a form of a chart in the dashboard) as a table with timestamps?
If you are looking to present this tabular information on the Home Assistant Lovelace user interface, I have yet to find a good spreadsheet like presentation. There are couple, but none were very useable for me.
If you want to extract the data externally and save it as csv, json or other format file and open in a spreadsheet or other external application, you can use this command line tool. It runs anywhere that HA web GUI runs as it uses the same calls but from the command line. There are examples of pulling a sensors data from the HA recorder history:
Thanks. Do you know what is the command that pulls out the light sensor data?
If you are familiar with SQL, you should be easily able to extract a table of data from this with an SQL query on the DB.
Sorry, this is too much to my knowledge level…
To use the hass-cli command, you would find the techie name of the light sensor, you just go a bit further into the menus of the chart display that you showed above in your post. And then for example the query to get my Hue Light Sensor would be:
hass-cli state history --since 6h sensor.backyard_sensor_light_level_hue
Thanks man. I’ll try this
is your home assistant connected to nabu casa for remote access? if so there is a bug in hass-cli to be aware of.
here is a google sheet example of processing output of hass-cli history
Thanks for bringing it up.