LibreOffice Calc?
Basically the same as MS Excel.
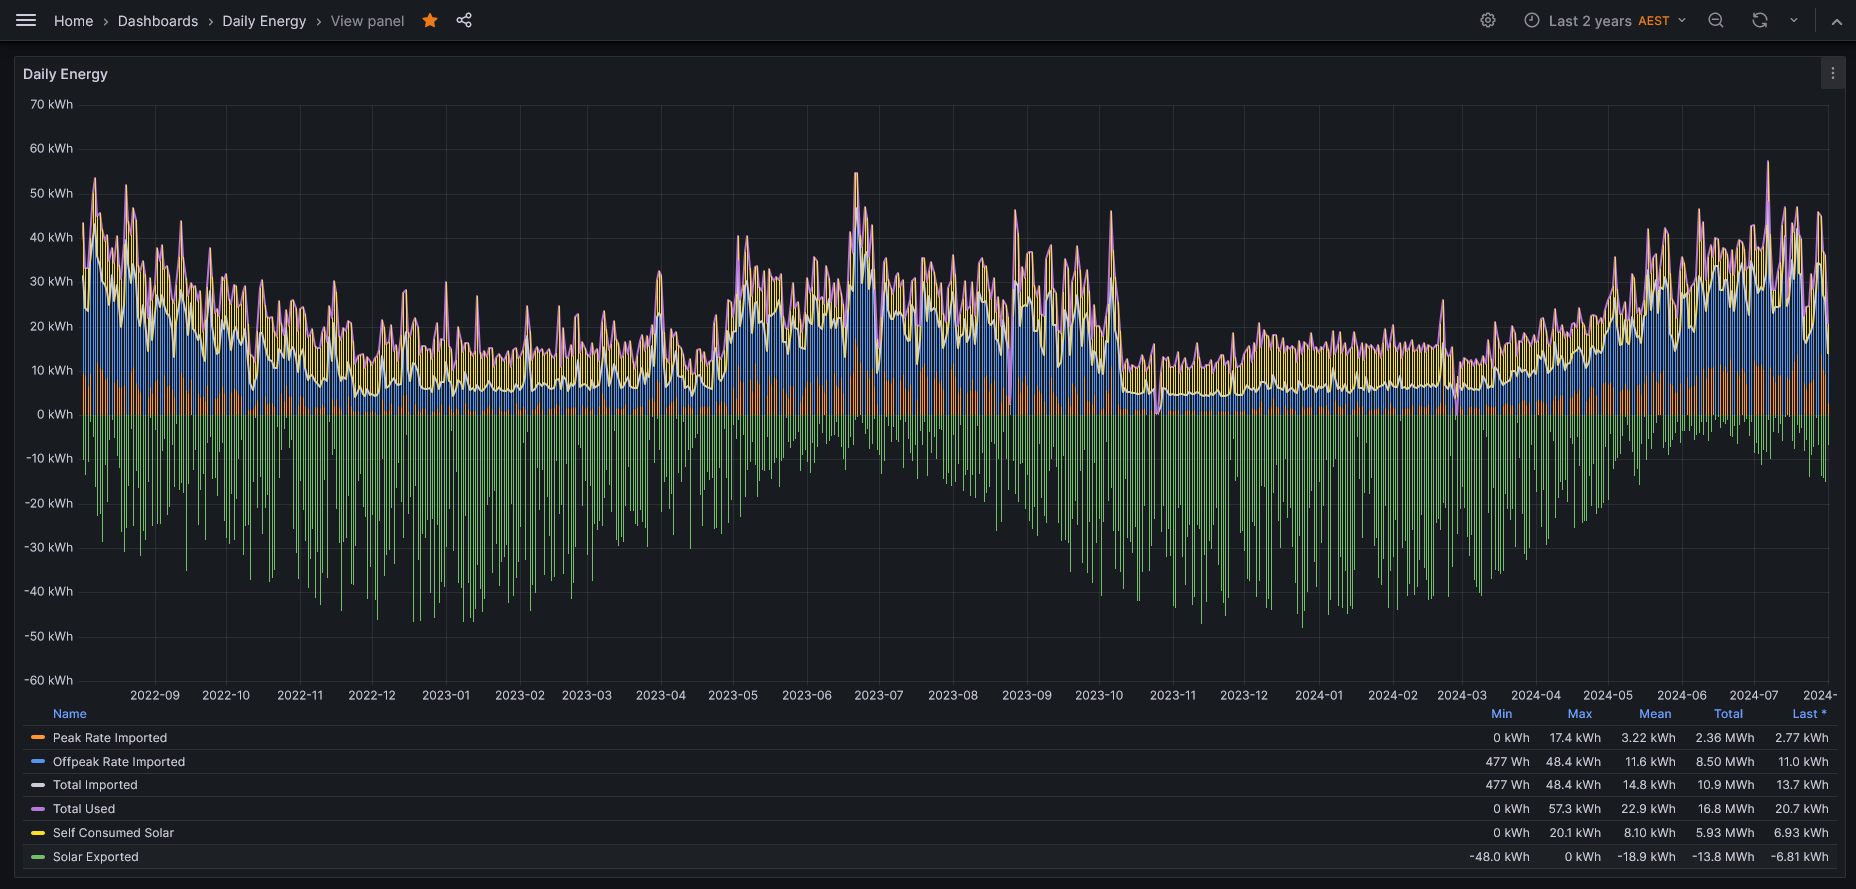
Personally I think using InfluxDB and Grafana is a far better option. Here’s a “speed-run” tutorial:

The only thing it does not cover is includes if you use those in the InfluxDB set up in Home Assistant then you only record the data you need for 1 or more years. There are examples at the bottom of the documentation: InfluxDB - Home Assistant
Some Examples:

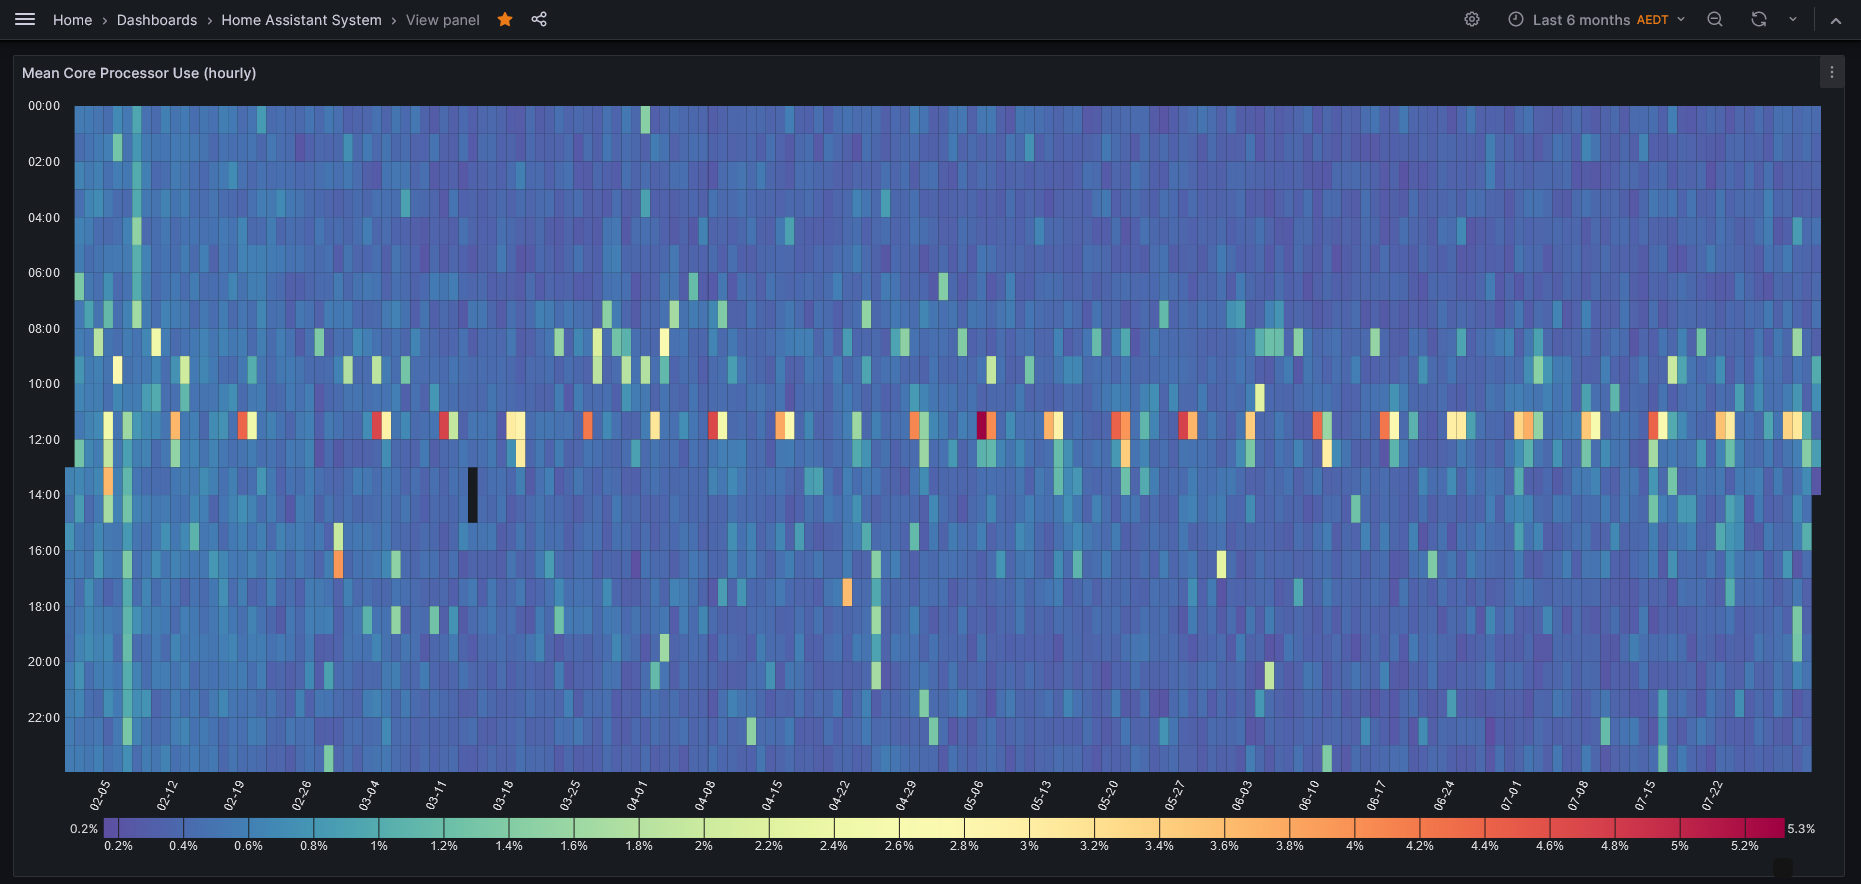
Note that last one requires a plug-in that no longer works with the current version of Grafana. I’m still hoping someone will fix it, until them I’m not updating the add-on.