No the data is completely wrong. These graphs were working fine until the latest updates
1 Like
How these graphs are supposed to be compared?
The stock history-graph shows (supposed to) real values.
The mini-graph-card shows approximated values - and this approximation depends on parameters like smoothing, points_per_hour, aggregate_func.
You even have not provided showing Y-labels on the 1st graph and same hours_to_show.
To perform an analysis, you should ensure same settings for both cards.
I’ve been running these graphs for months. I know what they are supposed to look like. The daily energy graph should look like a staircase going upwards and it resets to 0 everyday. I get that you can’t compare these exactly but the point was that something has changed and it’s obvious from the min and max values.
This is showing the same data in the stock graph and mini-graph-card. Obviously the mini-graph-card is wrong. Ther mini-graph-card shows a steep increase. I believe this happened when I upgraded to 2022.6.1


cards:
  - entities:
      - entity: sensor.lumi_6d760604_temperature
    extrema: true
    font_size: 58
    height: 350
    hour24: true
    hours_to_show: 24
    index: 0
    line_color: blue
    line_width: 4
    name: Eingang
    points_per_hour: 60
    type: custom:mini-graph-card
How to compare mini-graph-card & history-graph:
Some people are experiencing a bug now.
To compare graphs - use this card.
(it uses the same method as was used here)
- Create 4 helpers:
input_number:

  test_compare_graphs_padding_left: &ref_padding
    min: 0
    max: 200
    step: 1
    mode: box
  test_compare_graphs_padding_right: *ref_padding
  test_compare_graphs_padding_top: *ref_padding
  test_compare_graphs_padding_bottom: *ref_padding
-
Create a “panel” view.
-
Place this card on a view:
type: vertical-stack
cards:
  - type: entities
    entities:
      - entity: input_number.test_compare_graphs_padding_left
        name: padding-left
      - entity: input_number.test_compare_graphs_padding_right
        name: padding-right
      - entity: input_number.test_compare_graphs_padding_top
        name: padding-top
      - entity: input_number.test_compare_graphs_padding_bottom
        name: padding-bottom
  - type: custom:mod-card
    card_mod:
      style:
        hui-vertical-stack-card $: |
          div#root {
            display: grid;
          }
          div#root > * {
            grid-column-start: 1;
            grid-row-start: 1;
            margin: 0px;
            --ha-card-background: rgba(0,0,0,0);
          }
    card:
      type: vertical-stack
      cards:
        - type: custom:mini-graph-card
          entities:
            - entity: sensor.xiaomi_cg_1_pm25
          show:
            labels: false
            name: false
            state: false
            points: true
          line_width: 1
          hours_to_show: 1
          points_per_hour: 120
          update_interval: 0
          aggregate_func: last
          smoothing: false
          card_mod:
            style: |
              ha-card {
                padding-left: {{states("input_number.test_compare_graphs_padding_left")}}px !important;
                padding-right: {{states("input_number.test_compare_graphs_padding_right")}}px !important;
                padding-top: {{states("input_number.test_compare_graphs_padding_top")}}px !important;
                padding-bottom: {{states("input_number.test_compare_graphs_padding_bottom")}}px !important;
              }
        - type: history-graph
          entities:
            - entity: sensor.xiaomi_cg_1_pm25
          hours_to_show: 1
          refresh_interval: 0
-
Specify your own monitored sensor instead of “
sensor.xiaomi_cg_1_pm25” and a required frequency: since my sensor is updated every 30 sec, I am using “points_per_hour: 120”. -
Use input helpers to align graphs together.

Note that the mini-graph-card is updating and “scrolling” a graph to the left.
IMHO the history-graph should also automatically update and “scroll” to the left - but it does not seem to do it now (due to a recent bug I think).
After every update the alignment is lost, so you should re-align, make a screenshot and then analyse it in MS Paint (or whatever).
It’s not about comparing graphs. The data in the Mini graph card is simply wrong. Look at my graph above. 93.5 degrees celcius max!
This used to work correctly for a long time. Only after the HA upgrade it’s wrong.
- The proposed solution is not intended for YOUR personal case only. It is for comparing cards in general; for analysing a difference between different “
aggregate_func” values etc. - As for YOUR personal case - check the GitHub issue, some people sorted out a reason of their similar problems.
P.S. … not to mention errors in your code…
One more picture w/o a code, come on))
Start with this:
- restart HA (or the whole HA OS).
- restart DB if it is used in a separate container.
- clear cache.
Here is
Points 1 and 3 implemented
I don’t know how to restart the DB, I use HaOS on Rpi built-in DB
The only thing that preceded it was the exclusion of some entities from the recorder that had nothing to do with temperature.
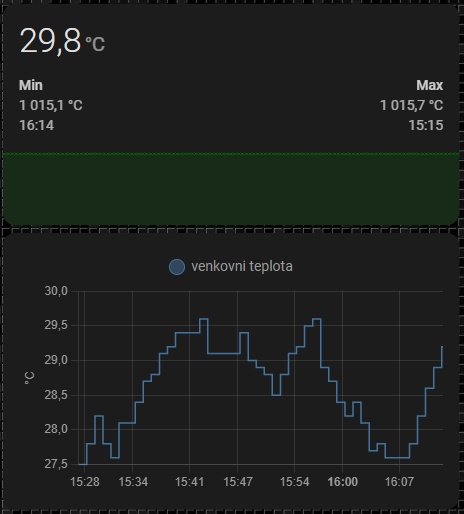
type: vertical-stack
cards:
  - type: custom:mini-graph-card
    entities:
      - entity: sensor.venkovni_teplota
        color: green
        show_state: true
        show_points: true
    hours_to_show: 1
    points_per_hour: 120
    aggregate_func: last
    update_interval: 0
    height: 80
    show:
      state: true
      points: true
      extrema: true
      name: false
      icon: false
    line_width: 1
    hour24: true
    lower_bound: ~0
    smoothing: false
  - type: history-graph
    entities:
      - entity: sensor.venkovni_teplota
    hours_to_show: 1
    refresh_interval: 0
I rebooted the host. It seems it’s now working fine again. Restarting HA did not help.

Could you specify a type of your installation?
I am using Debian + HA in Docker (with a native DB). Rebooting the HA causes rebooting DB server too.
I’ll restart the host one more time and let me know
Thanks for your help. I use raspberry pi with latest OS (bullseye) and HA Docker with default DB.
IMHO the situation is strange.
Yes, this HA version has some issues with Recorder, history-graph & Logbook.
From other side, it is strange that - w/o any reboots - history-graph shows SOMETHING and mini-graph-card does NOT.
Whose fault it is? Bugs in HA? Or mini-graph-card is just NOT ADAPTED to some new requirements, I don’t know…
Then it is strange that rebooting HA (all-in-one) could not help.
I agree. I don’t remember if I just restarted HA or restarted the Container. This time I rebooted the host.