could you share your config please?
Thanks in advance!
could you share your config please?
Thanks in advance!
Sure:
entities:
  - sensor.pi_hole_dns_queries_today
font_size: 85
icon: mdi:magnify
line_color: green
line_width: 1
points_per_hour: 2.5
show:
  average: true
  extrema: true
  graph: bar
name: DNS Queries Today
type: custom:mini-graph-card
Very nice card!
Can you share the code?
Hi,
Question, is it possible to show also the min/max/avrg of the second entity?

Here you go…
type: custom:mini-graph-card
name: Woonkamer
align_icon: left
align_header: left
show:
  extrema: true
  average: true
entities:
  - entity: sensor.woonkamer_temperature
  - entity: sensor.woonkamer_humidity
    show_graph: false
    show_state: true
  - entity: sensor.woonkamer_battery
    show_graph: false
    show_state: true
  - color: gray
    entity: sensor.nightstate
    name: Night
    show_legend: false
    show_line: false
    show_points: false
    y_axis: secondary
How to nicely align legend’s elements:
Here is a case:
– 5 graphs are displayed on a card;
– 3 sensors have names like “xxxxx 1…3”, 2 sensors have names like “yyyyy 1…2”;
– alternatively: 3 sensors represent a “temperature”, 2 sensors - a “pressure”.
Dependingly on names’ length & the card’s width, a legend may look lake this:

or like this:

where sensors are “mixed” in the “Legend”.
But this may be changed to this aligned view:

type: custom:mini-graph-card
entities:
  - entity: sensor.rb260gs_0_snmp_uptime
    name: RB260GS_0
  - entity: sensor.rb260gs_1_snmp_uptime
    name: RB260GS_1
  - entity: sensor.rb260gs_2_snmp_uptime
    name: RB260GS_3
  - entity: sensor.ac68u_snmp_uptime
    name: router 1
  - entity: sensor.ac66u_snmp_uptime
    name: router 2
show:
  name: false
  icon: false
  state: false
card_mod:
  style: |
    .graph__legend__item {
      flex-basis: 25%;
      justify-content: center
    }
Note: the value “25%” may differ dependingly on names’ length, the card’s width, number of sensors - so experiment.
In the example above the 1st “group of sensors” contain more sensors than the 2nd “group” - so it is safe to apply the style to ALL legend’s elements; otherwise it is required to apply the style to PARTICULAR legend’s elements:
    card_mod:
      style: |
        .graph__legend__item:nth-child(-n+2) {
          flex-basis: 40%;
          justify-content: center
        }

Isn’t there any support for hold_action on the mini graph card? I would like to be able to tap to navigate but hold to show more details about the entity.
How do I change the color of the title and icon for this card, and can i adjust the icon size?
use card-mod
/config/www didn’t exist so I created it and downloaded the JS into it. Added the resource in the config yaml, rebooted and nothing. Is this process up to date?
If you mean “how to install mini-graph-card” - I myself suggest using HACS.
HACS makes it easy to install however it still fails to show when adding the card with error:
Custom element doesn’t exist: mini-graph-card.
I can see it in the settings > dashboard though which is odd.
I cannot help, unfortunately.
For 2 years a have never faced a problem like “Custom element doesn’t exist: xxxx” with any of my cards…
Using HA in Docker, if it matters.
HACS is installed.
Is it possible to use color_thresholds per entity and not for the entire card?
I mean, two entities with different color_thresholds schemes.
I’ve been trying to do so but doesn’t seem to work
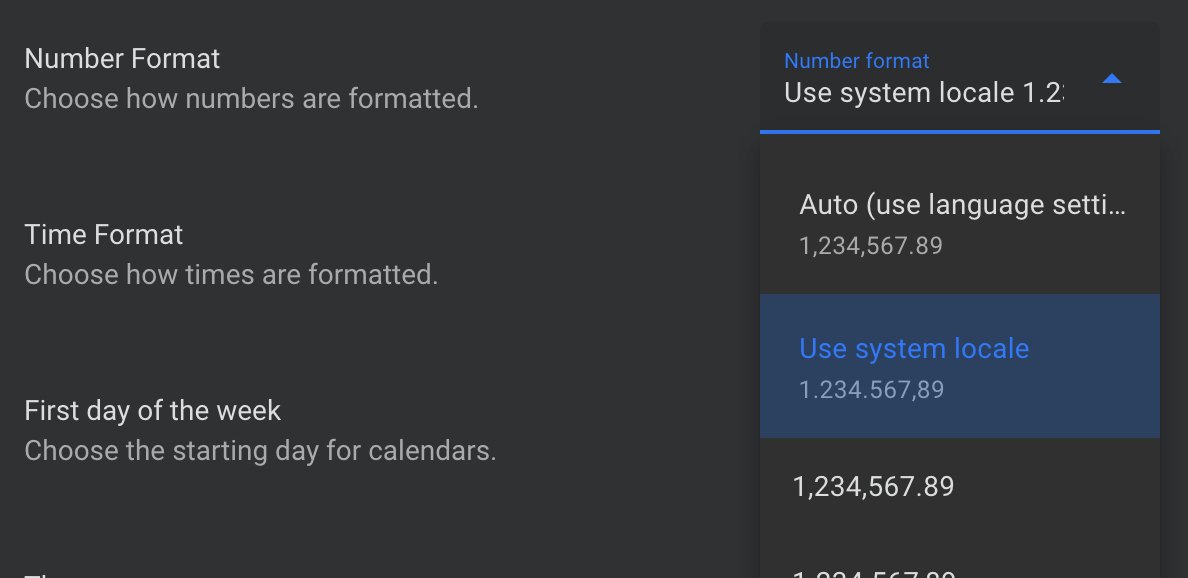
Mini graph doesn’t follow locale settings in HA and its annoying

my card is here:
type: custom:mini-graph-card
entities:
  - entity: sensor.plug_washingmachine_power
  - entity: sensor.plug_washingmachine_energy
    show_graph: false
    show_state: true
points_per_hour: 4
show:
  labels: false
  labels_secondary: false
  name: true
  graph: bar
align_state: left
align_header: left
align_icon: left
name: Washing machine
icon: mdi:washing-machine
icon_adaptive_color: true
hour24: true
font_size: 60
hours_to_show: 6
color_thresholds:
  - value: 1
    color: cyan
  - value: 2
    color: orange
hi @typxxi I am searching here in this topic and also at Apex-charts topic for a simple question:
can we graph a 12 month bar chart for e.g. the energy production/consumption?
But please: I don’t need to aggregate, summarize the data anyhow (no “aggregate-by xxx” function needed), since I already have all the data in the XML and I can read them. The only question is how to show them in the graph - e.g. via the data generator?
the XML looks like this:
- <stat_year>
  <SYD>2022-05-11</SYD>
  <SYS1>171.73</SYS1>
  <SYH1>10.79</SYH1>
  <SYL1>129.04</SYL1>
  <SYP1>231.96</SYP1>
  <SYS2>305.60</SYS2>
  <SYH2>71.23</SYH2>
  <SYL2>547.26</SYL2>
  <SYP2>507.64</SYP2>
  <SYS3>213.82</SYS3>
  <SYH3>147.22</SYH3>
  <SYL3>802.22</SYL3>
  <SYP3>501.10</SYP3>
  <SYS4>80.51</SYS4>
  <SYH4>183.05</SYH4>
  <SYL4>759.23</SYL4>
  <SYP4>210.48</SYP4>
  <SYS5>16.35</SYS5>
  <SYH5>289.30</SYH5>
  <SYL5>1199.00</SYL5>
  <SYP5>77.19</SYP5>
  <SYS6>6.23</SYS6>
  <SYH6>314.37</SYH6>
  <SYL6>1211.69</SYL6>
  <SYP6>42.41</SYP6>
  <SYS7>32.07</SYS7>
  <SYH7>228.49</SYH7>
  <SYL7>949.66</SYL7>
  <SYP7>95.13</SYP7>
  <SYS8>139.76</SYS8>
  <SYH8>107.66</SYH8>
  <SYL8>691.64</SYL8>
  <SYP8>321.43</SYP8>
  <SYS9>334.51</SYS9>
  <SYH9>63.50</SYH9>
  <SYL9>288.46</SYL9>
  <SYP9>469.01</SYP9>
  <SYS10>333.28</SYS10>
  <SYH10>16.97</SYH10>
  <SYL10>172.76</SYL10>
  <SYP10>554.21</SYP10>
  <SYS11>425.52</SYS11>
  <SYH11>21.16</SYH11>
  <SYL11>125.40</SYL11>
  <SYP11>704.07</SYP11>
  <SYS12>531.32</SYS12>
  <SYH12>17.70</SYH12>
  <SYL12>141.19</SYL12>
  <SYP12>761.68</SYP12>
  </stat_year>
and I am able to address the nests via a multiscrape function and get all 4 data rows
1- house own consumption from solar panels,
2- total photovoltaic production,
3- grid consumption high tarrif and
4. grid cons. low tarrif
these 4 data series are all I need (I guess) to calculate and get some reasonable results for all graphs.
but the question remains: How do i plot the graph (minigraph, apexcharts …) if I have 4 data monthly series ?? (On the X-axis I want just to have: Jan, Feb, Mar, … etc)
So far didnt find anything resonable, just the links to grafana or some other more sophisticated tools, what I guess are not necessary for just showing 12 bar charts?
Somebody help please 
i’d love to see your yaml for this
Did you figure it out?
xD
i’m interested if you had figured it out?