Lovelace: mini graph card

Probably choosing a bar graph.
Replace “bar” with “line” - if you see a significant difference then this means that my assumption was correct.

Thanks for the Tip,
yes with line it seems to work properly, it just doesn’t look that nice anymore. I guess I have to play with line thickness/number of points.

does anyone know if it is possible to display the graphs differently for several entities? I would like to configure one with fill: fade and one with fill: false. But if I set the ‘show’ block individually under entity: ..., the settings are ignored. Presumably the graphs can only be configured together, right?

  - type: custom:mini-graph-card
    entities:
      - entity: sensor.klimasensor_1_temperature
        name: Temperatur
        color: var(--green-color)
      - entity: sensor.klimasensor_1_humidity
        name: Luftfeuchtigkeit
        color: var(--blue-color)
        y_axis: secondary
        show: # block is ignored!
          fill: false 
    hours_to_show: 24
    line_width: 3
    font_size: 50
    animate: true
    show: # only this block is adopted for both entities
      name: false
      icon: false
      state: false
      legend: false
      fill: fade

You may only do things described in docs.
The “show” option is GLOBAL.
The “show_fill” option is per-entity.

Thanks for the tip! I had not distinguished between show (global) and show_fill :see_no_evil:

1 Like

Styling labels’ background:
(answering this issue)

type: custom:mini-graph-card
entities:
  - sensor.xiaomi_cg_1_temperature
show:
  labels: true
card_mod:
  style: |
    ha-card .graph .graph__container .graph__labels span {
      background-color: green;
    }

изображение


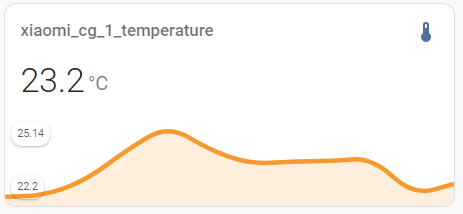
Set a color to transparent to make a background less visible:

type: custom:mini-graph-card
entities:
  - sensor.xiaomi_cg_1_temperature
show:
  labels: true
card_mod:
  style: |
    ha-card .graph .graph__container .graph__labels span {
      background-color: transparent;
    }

изображение

or even hide it totally:

type: custom:mini-graph-card
entities:
  - sensor.xiaomi_cg_1_temperature
show:
  labels: true
card_mod:
  style: |
    ha-card .graph .graph__container .graph__labels span {
      background-color: transparent;
      box-shadow: none;
    }

изображение

3 Likes

Hey,
Here is some code I use to visualise my EV charger usage.

                  - type: custom:mini-graph-card
                    name: Charging power
                    entities:
                      - entity: sensor.go_echarger_202512_nrg_12
                        show_legend: false
                      - entity: binary_sensor.go_echarger_202512_car
                        name: Status
                        color: gray
                        show_line: false
                        show_points: false
                        show_legend: false
                        y_axis: secondary
                    show:
                      labels: true
                      labels_secondary: false
                    state_map:
                      - value: "off"
                        label: Disconnected
                      - value: "on"
                        label: Connected
                    height: 180
                    line_width: 2
                    font_size_header: 20
                    hour24: true
                    hours_to_show: 36
                    points_per_hour: 12

It generates the following image, where the yellow line is charging power over time and the gray background depicts whether a car was connected to it or not.

However, that “Disconnected” label is not supposed to be there, nor at the left side as it belongs to the car dis/connected data that’s defined for the (hidden) secondary axis on the right. Also the data does not look right, and when inspected with the system history graph, the following is show:


So what’s going on in here? Essentially all the data from (at least) 00:00 March 6 is zero. All the x-axis (time) are the same. A bug or some kind of misuse?

Update: fixed by restarting the server, except that label. Strange.

Hi folks,
any way to stretch the graph? I’d like to have it filling the hole card. Or at least two thrid.
Its just a binary sensor for the windows.
I want to keep the card itself at a fixed height of 100. Just a bigger graph
image

type: custom:mini-graph-card
entities:
  - binary_sensor.raum_wohnzimmer
name: ""
height: 100
font_size: 60
hours_to_show: 12
points_per_hour: 30
line_color: grey

show:
  labels: false
  state: false
  points: false
  name: false
  icon: false
line_width: 8
hour24: true
state_map:
  - value: 'off'
    label: zu
  - value: 'on'
    label: offen

Please tell me how to hide the names?
2023-03-09_11-49-40

Displaying a legend is controlled by a “legend” option - RTFM.

1 Like

Tell me please.
I have the temperature and humidity readings of one sensor in my code. The color scheme is written for the two lines in the same way. Is it possible to set the line colors separately for each line separately?

>     cards:
>       - type: custom:mini-graph-card
>         entities:
>           - sensor.datchik_temperatury_na_vtorom_etazhe_temperature
>           - sensor.datchik_temperatury_na_vtorom_etazhe_humidity
>         hours_to_show: 24
>         points_per_hour: 2
>         line_width: 1
>         hour24: true
>         animate: true
>         height: 80
>         show:
>           extrema: false
>           icon: false
>           name: false
>           legend: false
>         color_thresholds:
>           - value: 30
>             color: '#d32f2f'
>           - value: 20
>             color: '#388e3c'
>           - value: 10
>             color: '#0000ff'

Hi, I would like to display the duration of a timer per day. But it dosnt works.

type: custom:mini-graph-card
show_state: false
state_map:
  - value: idle
    label: test
  - value: active
    label: test
entities:
  - entity: timer.gardena_ventil_feuer
name: Feuerstelle
hours_to_show: 168
height: 300
aggregate_func: avg
group_by: date
show:
  graph: bar
  name: true
  legend: true
  icon: true
  labels: false
  state: false

bar1

There are no values (Date and Durations) at the bars …?
Thankyou!

All my mini graph cards are flat for a few days. Did something break in a recent update?
I updated to 2023.3 yesterday but i’m pretty confident it was already occurring a few days prior. I’ve not changed anything with my recorder settings. The history graphs look fine. These graphs (and all my others including bar charts) have worked fine for about a year until now.

  • minimal mini-graph-card config to demonstrate an issue, w/o color_thresholds & state_map, for only ONE sensor which is flatlined:
type: custom:mini-graph-card
entities:
  - entity: sensor.new_lambton_temp
show:
  labels: true
hours_to_show: 24
points_per_hour: 60
smoothing: false
aggregate_func: last
line_width: 1
lower_bound: 0

  • a screenshot of that min-graph-card (default light theme);

image

  • a conventional history graph for the same hours_to_show for the same ONE sensor - not a History page, not a more-info (read above why more-info may be WRONG);
type: history-graph
entities:
  - entity: sensor.new_lambton_temp
hours_to_show: 24
  • a screenshot of that history-graph (default light theme);

image

  • info about sensor - how often it is polled (a real update freq);

    • polled every 10 minutes
    • provided by a custom BOM integration
    • other sensors from other integrations also effected, including template sensors which update as frequently as every 3 seconds
  • when you started observing flatlines (after which event, after which HA update);

    • approx 1 week ago. Not after any particular event. It was prior to updating to 2023.3.x but is possibly resolved since that update which i performed yesterday. Previously I was on 2023.2.x
  • did it stop after HA reboot or after clearing a browser’s cache (also, test with cache: false option);

    • No

    • Even if updating to 2023.3.x resolved it now, after the update all previous hours were still flat, but now that 1 day has passed, those flat areas are beyond the visible area on my dashboard.

  • For the bar chart which goes back 10 days it is still reproducible.

  • difference in different browsers if present.

    • none, occurred on multiple browsers on multiple machines. Including brave, edge, chrome.
  • one bonus point sorry

    • Changing any parameter and saving fixed the charts. reverting the change later caused the issue to reappear.

Edit your post (to avoid scattering data in several places), add additional info as described here.
Some people also faced a similar behaviour, reasons are different (a possible bug in mini-graph-card, issues with Recorder, a wrong use in MOST cases).
I myself observe flatlines ONLY when there are issues with Recorder - so same flatlines are with history-graph.

Update: copy/pasted since you do not have access to Github:

1.One issue = 1 post. No “wrote above/earlier”, all info in ONE place.
2.One post must contain this info:
– minimal mini-graph-card config to demonstrate an issue, w/o color_thresholds & state_map, for only ONE sensor which is flatlined:

type: custom:mini-graph-card
entities:
  - entity: sensor.my_sensor
show:
  labels: true
hours_to_show: 24 ## not too big & not too small - to show that 2/3 of time the graph is OK, then became flatlined
points_per_hour: 60 ### at least equal to the real update interval or x2
smoothing: false
aggregate_func: last
line_width: 1
lower_bound: 0 ### or any other value to see a flatline

– a screenshot of that min-graph-card (default light theme);
– a conventional history graph for the same hours_to_show for the same ONE sensor - not a History page, not a more-info (read above why more-info may be WRONG);
– a screenshot of that history-graph (default light theme);
– info about sensor - how often it is polled (a real update freq);
– when you started observing flatlines (after which event, after which HA update);
– did it stop after HA reboot or after clearing a browser’s cache (also, test with cache: false option);
– difference in different browsers if present.

P.S. Do not use default values for hours_to_show, points_per_hour & smoothing, use what is explained above.

1 Like

I can’t access github currently unfortunately, updated with the yaml. let me know if I should post anything further.

Updated, check above.
+replace “bar” with “line”
+no grouping

1 Like

Appreciate it, I will update the original post further in a moment but seem to have resolved both.

For the line graph, changing the hours to show to 24 or removing the hour24: true parameter and saving seemed to fix it. (didn’t try everything, but those work)

For the bar graph, removing color_thresholds_transition: soft fixed that too.

very odd. I’ll see what i can figure out.

edit, seems changing any one thing fixes it, but reverting it causes the issue again, maybe a cache issue, but on multiple devices seems unlikely.

This is a guesswork, but if it solved your issue, then fine.

I told that first you should test & provide results for the case described there (+ no grouping & no bars) to simplify.