kalkih I know that you have written that you wont add the time line in X-axis but I would like to post my interesset in this also.
Hoping you will reconsider…

Nothing is set in stone ![]() I might add it in the future if I have some time over and feel inspired I guess.
I might add it in the future if I have some time over and feel inspired I guess.
Or If anyone else would like to implement it and make a PR that would be great.
2 Likes
loving my graph card made my home assistant better looking Thanks again kalkih 

Heres the code
- type: vertical-stack
cards:
- type: picture
image: /local/ha3.jpg
- type: horizontal-stack
cards:
- type: vertical-stack
cards:
- type: horizontal-stack
cards:
- type: horizontal-stack
cards:
- type: vertical-stack
cards:
- type: vertical-stack
cards:
- type: custom:monster-card
show_empty: false
card:
type: glance
column_width: calc(100% / 4)
show_name: true
show_state: false
title: Devices Online
filter:
include:
- domain: device_tracker
state: 'home'
- type: custom:monster-card
show_empty: false
card:
type: glance
column_width: calc(100% / 4)
show_name: true
show_state: false
title: Devices Offline
filter:
include:
- domain: device_tracker
state: 'not_home'
- type: entities
title: Cheynes Devices
show_header_toggle: true
entities:
- device_tracker.cheynes_ipad
- device_tracker.iphone
- sensor.cheynes_ipad_battery_level
- sensor.cheynes_ipad_battery_state
- sensor.iphone_battery_level
- sensor.iphone_battery_state
- type: history-graph
title:
hours_to_show: 36
refresh_interval: 15
entities:
- device_tracker.cheynes_ipad
- device_tracker.iphone
- type: picture
tap_action:
action: navigate
navigation_path: /lovelace/0/
image: /local/ha.jpg
- type: vertical-stack
cards:
- type: vertical-stack
cards:
- type: glance
title: Remaining Disk Space
entities:
- entity: sensor.sonarr_disk_space
name: NAS Drive
- entity: sensor.sonarr_disk_space_2
name: USB Server
- entity: sensor.sonarr_disk_space_3
name: TV Server
- type: glance
title: Torrent Downloads on Server
column_width: calc(100% / 3)
show_name: true
show_state: true
entities:
- sensor.deluge_status
- sensor.deluge_down_speed
- sensor.deluge_up_speed
- type: horizontal-stack
cards:
- type: custom:mini-graph-card
title: Current Download Speed
hours_to_show: 2
line_width: 1
line_color: green
points_per_hour: 360
height: 75
entities:
- sensor.synology_srm_kbyte_sec_received_16
- type: custom:mini-graph-card
title: Current Upload Speed
hours_to_show: 2
line_width: 1
line_color: green
points_per_hour: 360
height: 75
entities:
- sensor.synology_srm_kbyte_sec_sent_16
- type: vertical-stack
cards:
- type: custom:mini-graph-card
title: Line Speedtest
hours_to_show: 150
height: 75
line_width: 2
entities:
- sensor.speedtest_download
- sensor.speedtest_upload
- type: custom:mini-graph-card
title: Ping
hours_to_show: 150
line_width: 2
height: 75
line_color: green
entities:
- sensor.speedtest_ping
- type: vertical-stack
cards:
- type: vertical-stack
cards:
- type: glance
title:
columns: 5
show_name: true
show_state: true
entities:
- sensor.total_amps_currently
- sensor.total_all_power
- sensor.energy_daily
- sensor.total_power_todays_cost
- sensor.total_power_daily_yesterday_cost
- type: custom:mini-graph-card
title: Living & Kitchen Power Usage
hours_to_show: 360
points_per_hour: 360
refresh_interval: 719
height: 50
entities:
- sensor.total_power_daily_yesterday_cost
show:
graph: bar
#
- type: custom:mini-graph-card
title: All Power Usage
hours_to_show: 24
# state: false
legend: false
name: false
icon: false
line_width: 2
points_per_hour: 360
refresh_interval: 10
entities:
- sensor.liv_kit_current_power
- sensor.current_power
- sensor.air_conditioner_power
- sensor.washer_current_power
- type: custom:mini-graph-card
title: Total all Power
hours_to_show: 24
line_width: 2
points_per_hour: 60
refresh_interval: 100
line_color: blue
entities:
- sensor.total_all_power
- type: custom:mini-graph-card
hours_to_show: 24
height: 75
line_width: 2
line_color: red
entities:
- sensor.energy
#
2 Likes
Very cool setup, looks great!
Thanks for sharing. ![]()
1 Like

8 Likes
awesome design !
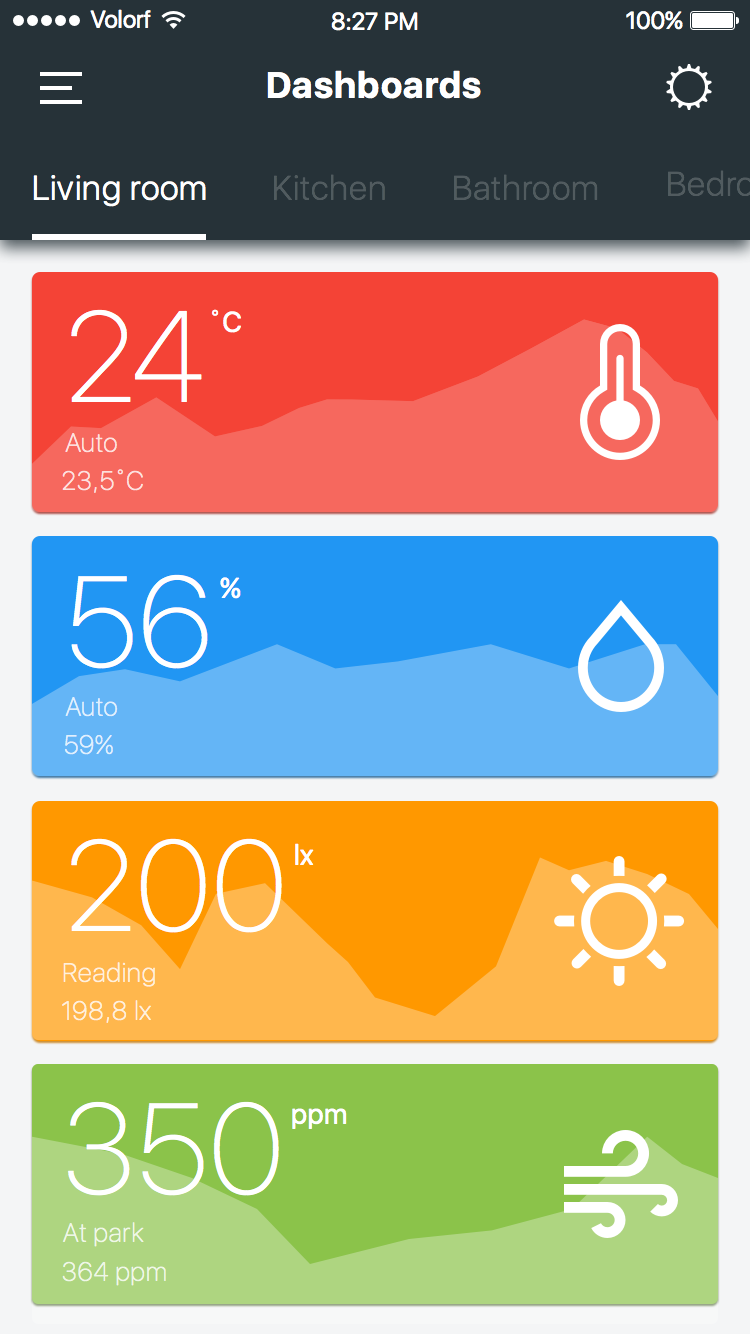
Oh, someone actually posted the same design concept in the github repo a few days ago. ![]()
Looks fantastic, not sure how well it fits with the overall design of HA though.
Should be pretty easy to make that design come to life by forking this card and making some design/layout adjustments.
Would be cool if anyone wanna give it a shot (simple-graph-card?), if not, I might. ![]()
Btw, does anyone know the creator/origin of the design?
3 Likes
2 Likes
Wauw, how do you do the current power consumption? So, the one mentioning watt?
Hi. Is it somehow possible to show two sensor values in one graph card? Adding more sensors to graph, it shows multiple graph lines, but only first sensor value. Thanks.
anyone have issues with zigbee2mqtt sensors? Not show any graph 
Yes, by using the optional show_state option in the entity object in the config. First listed sensor has state visible by default so no need for show_state there.
- type: custom:mini-graph-card
  entities:
    - entity: sensor.one
    - entity: sensor.two
      show_state: true
1 Like
Works OK for me with Xiaomi sensors via Z2M.
Hi! Can you share your xiaomi sebsor config?
Thanks
Can you check the browser dev console for potential errors.
Here’s an example.
mqtt integration for xiaomi environment sensor:

mini graph card with this sensor:
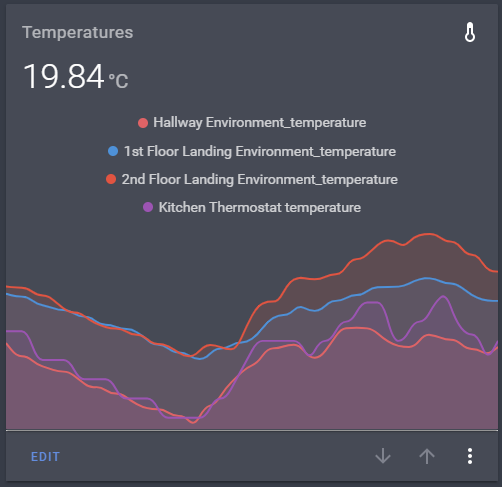
card config:
cards:
  - entities:
      - entity: sensor.0x00158d00012bf150_temperature
        unit: °C
      - entity: sensor.0x00158d00012cb3a8_temperature
        unit: °C
      - entity: sensor.0x00158d0001583845_temperature
        unit: °C
      - entity: sensor.kitchen_thermostat_temperature
        unit: °C
    height: 200
    hours_to_show: 24
    line_width: 2
    name: Temperatures
    points_per_hour: 2
    type: 'custom:mini-graph-card'
type: vertical-stack
1 Like
Does anyone have an example of cobining auto-entities with mini-graph-card ?
I can’t get it to work.
here the code of two test examples:
views:
  - title: Test
    path: test
    cards:
      - type: custom:auto-entities
        card:
          type: custom:mini-graph-card
        filter:
          include:
            - entity_id: sensor.eg_wohnzimmer_temperatur_bei_treppe
            - entity_id: sensor.eg_buro_temperatur
      - type: custom:auto-entities
        card:
          type: entities
        filter:
          include:
            - entity_id: sensor.eg_wohnzimmer_temperatur_bei_treppe
              options:
                type: custom:mini-graph-card
            - entity_id: sensor.eg_buro_temperatur
              options:
                type: custom:mini-graph-card
I used two sensor’s here with entity_id to make it more transparent.
But the end result will be based on the filter:
- domain: sensors
  group: group.eg
in my case this would result in all temperatures from the group.
But the first card does just show nothing and result in the following error in the console:
Uncaught (in promise) TypeError: Cannot read property 'state' of undefined
at HTMLElement.shouldUpdate (mini-graph-card-bundle.js?track=true:1)
at HTMLElement.performUpdate (mini-graph-card-bundle.js?track=true:1)
at HTMLElement._enqueueUpdate (mini-graph-card-bundle.js?track=true:1)
and the second ends with the red error in the UI:
The "entity" option was removed, please use "entities". See https://github.com/kalkih/mini-graph-card/blob/master/README.md
{
  "entity": "sensor.eg_wohnzimmer_temperatur_bei_treppe",
  "type": "custom:mini-graph-card"
}
The "entity" option was removed, please use "entities". See https://github.com/kalkih/mini-graph-card/blob/master/README.md
{
  "entity": "sensor.eg_buro_temperatur",
  "type": "custom:mini-graph-card"
}@kalkih Is it possible to request the ability to scale out further then hours would be good for view for month/year its hard to set resolution with points_per_hour with a sample size so large.
1 Like
Maybe in the future, doesn’t feel that urgent since it just takes a few extra seconds to calculate it manually, but yes would be convenient and way more user friendly.
1 Like
I guess auto-entities specifies the entity as the entity option in the card config while this card require the entity to be specified in the entities option (because of the multi entity support), similar to the entities card.
I’ve not really used auto-entities unfortunately, so not really sure if you can do anything about it.