Lovelace: mini graph card

Hi,
I made some progress with variables. As suggested, I’m using mini-graph-card wrapped with config-template-card. This is my variable “graph_hours” which calculates difference from two timestamp values in hours:

type: custom:config-template-card
variables:
  graph_hours: |
    {(1644273000-1643324400)/3600}
entities:
  - graph_hours
card:
  type: custom:mini-graph-card
  name: Current B
  icon: mdi:current-ac
  smoothing: false
  hour24: true
  hours_to_show: ${graph_hours}
  points_per_hour: 0.4
  line_width: 2

It works as expected. But instead of this:

graph_hours: |
    {(1644273000-1643324400)/3600}

I would like to use formula like this:

graph_hours: |
    {(now().timestamp()-1643324400)/3600}

In this case I get nothing into graph card.
formula: (now().timestamp()-1643324400)/3600 is a positive number, ca 264.600…

Any suggestions?
Thanks for help

Is it JS code?

Not JS, this is code in card configuration:
Overview - Edit dashboard - Edit card.

You misunderstood me.
The config-template-card accepts JS code in templates.
The code you posted looks like a HA template extension code. That is why I asked you is it a JS code.

Hi,

I’m new in HA, so can you please assist me, how to check, if it’s JS code?

If this can help:
to checking calculated value, I also add the same formula (now().timestamp()-1643324400)/3600 into style parameter which successfully displays value in corner of mini graph card.

There is no style parameter inside the mini-graph-card.
Probably you mean card-mod style - then it is not JS, it is jinjia2 + HA template extension.
You need to find a JS analogue function for now().timestamp().

Hi… Need some help with styling…
I’ve got this by doing:

type: custom:mini-graph-card
entities:
  - sensor.vaderstation_temp_ute_temperature
show:
  name: false
  icon: false
  extrema: true
align_state: center
font_size: 250
name: TELLDUS
line_width: 3
color_thresholds:
  - value: 0
    color: blue
  - value: 4
    color: green
  - value: 10
    color: orange
  - value: 30
    color: red

But the part (extrema) is as big as temperature. How and which part do I need to change to make the extrema smaller? I’ve got card-mod installed but I cant find the right div to alter.

image

Answering my own question.

style: |
  div.info.flex {
    font-size: 20px; !important
  }

Did the trick… :slight_smile:

Yes, it should be JS. Calculation for my mini graph card finally works. This is the code of my working card:

type: custom:config-template-card
variables:
  graph_hours: |
    {(Math.round(Date.now() / 1000)-1643324400)/3600};
entities:
  - graph_hours
card:
  type: custom:mini-graph-card
  name: Current B
  icon: mdi:current-ac
  smoothing: false
  hour24: true
  hours_to_show: ${graph_hours}
  points_per_hour: 0.4
  line_width: 2

where 1643324400 is timestamp of sensor added to HS.

@Ildar_Gabdullin, many thanks for help.

Hi,

I have set up two different cards for the same sensor. The first one is mini graph card with period of 744 hours which is 31 days:

type: custom:mini-graph-card
name: Current B
icon: mdi:current-ac
smoothing: false
hour24: true
hours_to_show: 744
points_per_hour: 0.4
line_width: 2
entities:
  - entity: sensor.shellyem3_c45bbe6a86e2_channel_b_current
    show_state: true
color_thresholds:
  - value: 1
    color: green
  - value: 2
    color: yellow
  - value: 3
    color: orange
  - value: 4
    color: red
show:
  labels: true
  extrema: true

The second one is statistic graph card with 31 days to show:

type: statistics-graph
entities:
  - sensor.shellyem3_c45bbe6a86e2_channel_b_current
days_to_show: 31
stat_types:
  - max
chart_type: line

On date 13.2.2022, the statistics graph card shows data from 28.2.2022 (date when sensor is added), but mini graph cards shows data from 3.2.2022 (last 10 days) which means that max value is not calculated from beginning but only from last 10 days.

Is it possible to set mini graph card to display all data from day, when sensor s added to HA?

Thanks.

1 Like

Because the default recorder settings only retains 10 days of data — which is probably your issue.

I would youse the mini graph by creating a small square but I have a problem cause the design cut lower temperature when I click on dots.

Immagine

And anyone know if is there a way to fix the “name changing” from “name” value to “sensor” name when I go over the dots?

You can have a name for the entity set to the same string as for the cards name.

1 Like

Is it possible to define a line color based on the state of an entity? Something like below:

line_color:
  entity: climate.hvac
    state: cool
      color: blue
    state: heat
      color: red
    state: off
      color: gray

Hi all,
is it possible in any way to make the displayed extrema based on the graph shown instead of the whole history?

type: vertical-stack
cards:
  - type: custom:mini-graph-card
    entities: &ref_entities
      - entity: sensor.cleargrass_1_co2
    <<: &ref_settings
      name: CO2
      hours_to_show: 6
      points_per_hour: 60
    show:
      fill: fade
      extrema: true
      average: true
  - type: custom:mini-graph-card
    entities: *ref_entities
    <<: *ref_settings
    show:
      fill: false
      extrema: true
      average: true
  - type: custom:mini-graph-card
    entities: *ref_entities
    <<: *ref_settings
    show:
      fill: fade
      graph: false
      extrema: true
      average: true

1 Like

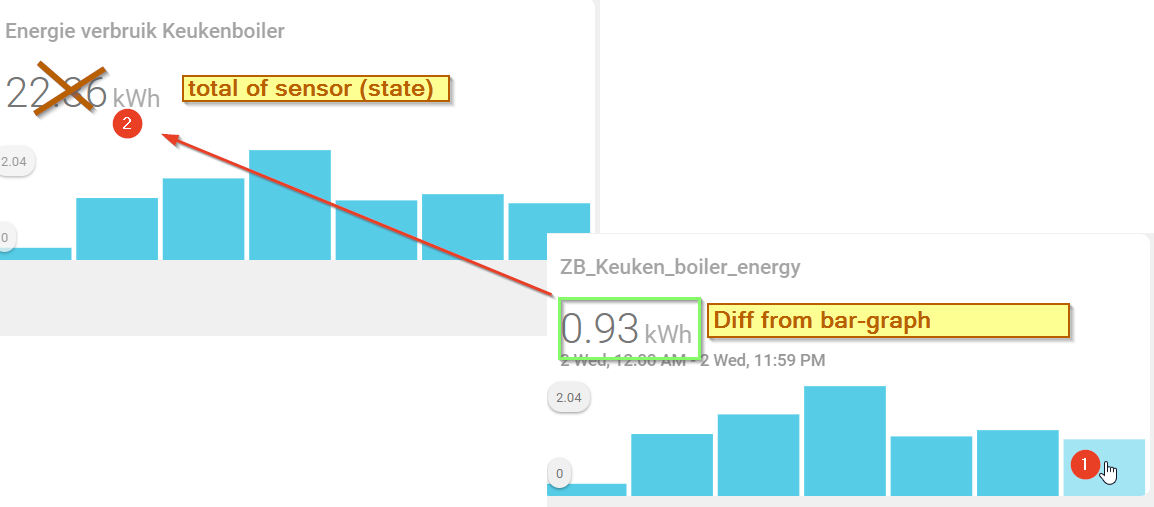
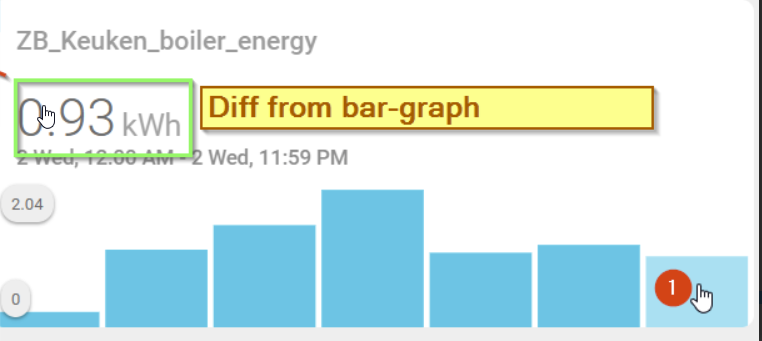
Is it possible to set the displayed state to the (last) diff calculation? the bar-graph is showing the diff between readings (group by date) but the state is always showing the whole sensor reading. I want to display the last diff state there. Just the same when you hover on the graph :

current code:

type: custom:mini-graph-card
entities:
  - entity: sensor.zb_keuken_boiler_energy
name: Energie verbruik Keukenboiler
show:
  graph: bar
  fill: fade
  icon: false
  labels: true
hours_to_show: 168
aggregate_func: diff
group_by: date

Is this what you want?

aggregate_func: delta
entities:
  - entity: sensor.zb_keuken_boiler_energy
    name: Energie verbruik Keukenboiler
group_by: date
hour24: true
hours_to_show: 168
icon: mdi:counter
line_width: 0
lower_bound: 0
name: Energieverbruik Keukenboiler maand
show:
  graph: bar
  labels: true
type: custom:mini-graph-card

thnx voor de help @archi071 , but thats just the same. only you use DELTA and I used DIFF
afbeelding

I want the value of the last bar in the top . so I know that I used 0.93kWh today.

I’m also trying a other approach by making a template sensor with lambda for it, but that’s also not easy for me :face_with_raised_eyebrow:

1 Like

Hi,

I have found the properties for the entities
show-graph and show-line ,
but not sure how they can work:

For my understading the entity wz_h should not be shown?
(but how then get the last value?)

That’s why an other question - could it be possible to show a second value permanent at the right side? Then we could display as sample temperature / humidity values and show one or both graphs below
image

Last question - the time format - could it be taken from HA config? Or can I modify it?
(I’m not using AM/PM but the 24hour format …)

THANKS!