Lovelace: performance-card prototype

Performance-card prototype.

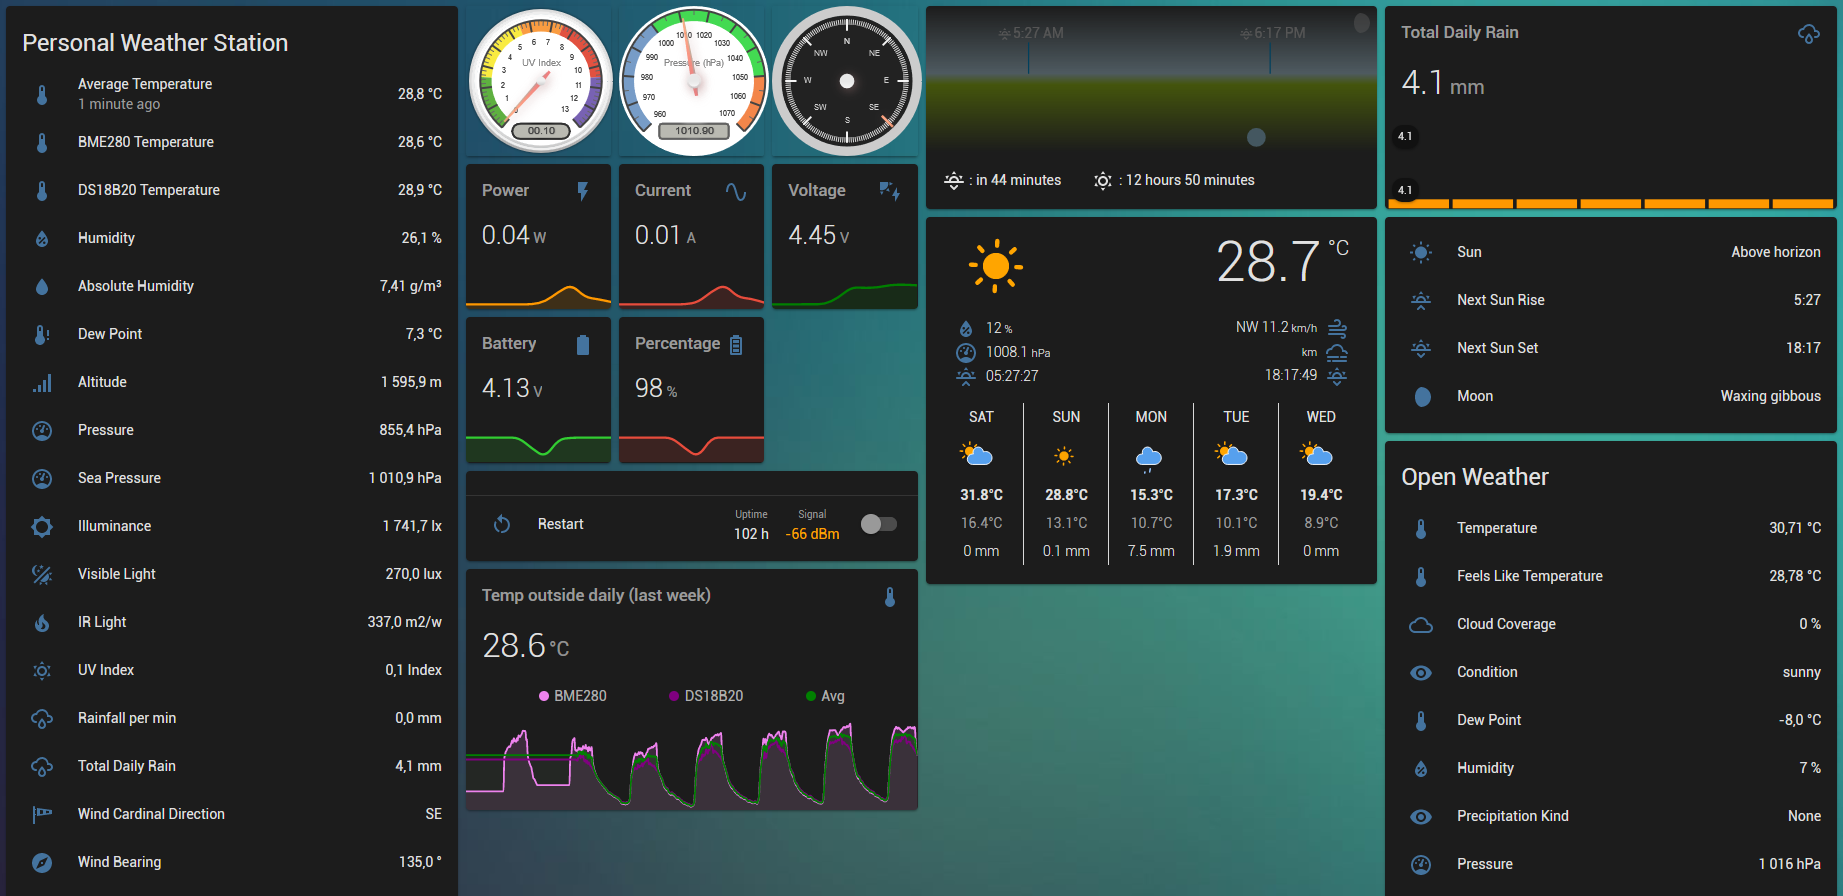
Let me know what you think. The gauges will be available soon as custom cards. It is in testing. This is an example using them with a picture elements card with background I made in photoshop. Thanks to https://github.com/Mikhus/canvas-gauges for maintaining the library I use for rendering the gauges.

image

5 Likes

Just teasing everyone now?

1 Like

much much much interested :slight_smile:

Hi not sure If im doing something wrong. Installed the card and try doing a 3 card-horizontal stack.
Looks good on the computer, but it cuts half of it in the mobile?
Thank you

I release this is an old thread but I have been using the canvas-guages and can’t figure out how to make the background on the outside of the gauge either disappear or transparent like the examples above.
Any help would be appreciated

try the vertical-stack-in-card custom card

@lolouk44,
This does not seem to work for me. Not sure if I have a formatting issue or something other.
Thoughts?

title: Testing
theme: dark-green
icon: mdi:sign-caution
panel: true
path: test_view
cards:
  - type: custom:vertical-stack-in-card
    title: My Card
    cards:
      - type: custom:canvas-gauge-card
        entity: sensor.my_ecobee_humidity
        font_size: 1em
        gauge:
          type: "radial-gauge"
          title: Inside Humidity (%RH)
          width: 320
          height: 320
          minValue: 0
          maxValue: 100
          startAngle: 45
          ticksAngle: 270
          valueBox: true
          majorTicks: ["0", "10", "20", "30", "40", "50", "60", "70", "80", "90", "100"]
          minorTicks: 2
          strokeTicks: true
          highlights: [
            {"from": 0, "to": 39,"color": "rgba(239, 93, 13, .75)"},
            {"from": 41, "to": 69,"color": "rgba(4, 205, 24, .75)"},
            {"from": 71, "to": 100,"color": "rgba(74, 123, 180, .75)"}
          ]
          borders: true
          colorPlate: "#ddd"
          animatedValue: true
          valueDec: 0

Apologies I misread and thought you didn’t want to see the frame around your cards in a stack.
What you need to do is to set a background for your view
This is what I have on one of my cards
background: url("/local/BMW_220d_GT.png") center / contain no-repeat
You may need to also toy with the custom card code on top of that. I don’t use that custom card so don’t know

Thanks for the code. Here’s my attempt.

image

entity: sensor.humidity_xiaomi_outside
font_size: 1em
gauge:
  type: radial-gauge
  title: Outside Humidity (%)
  width: 250
  height: 250
  minValue: 0
  maxValue: 100
  startAngle: 45
  ticksAngle: 270
  valueBox: true
  majorTicks:
    - '0'
    - '10'
    - '20'
    - '30'
    - '40'
    - '50'
    - '60'
    - '70'
    - '80'
    - '90'
    - '100'
  minorTicks: 2
  strokeTicks: true
  highlights:
    - from: 0
      to: 40
      color: 'rgba(74, 123, 180, .75)'
    - from: 40
      to: 70
      color: 'rgba(4, 205, 24, .75)'
    - from: 70
      to: 100
      color: 'rgba(239, 93, 13, .75)'
  borders: true
  colorPlate: ''
  colorNumbers: '#ccc'
  colorTitle: '#f5f5f5'
  animatedValue: true
  valueDec: 0
type: 'custom:canvas-gauge-card'
entity: sensor.temperature_xiaomi_outside
font_size: 1em
gauge:
  type: radial-gauge
  title: Outside Temp (°)
  width: 250
  height: 250
  minValue: 5
  maxValue: 40
  startAngle: 45
  ticksAngle: 270
  valueBox: true
  majorTicks:
    - '5'
    - '10'
    - '15'
    - '20'
    - '25'
    - '30'
    - '35'
    - '40'
  minorTicks: 2
  strokeTicks: true
  highlights:
    - from: 5
      to: 15
      color: 'rgba(74, 123, 180, .75)'
    - from: 15
      to: 25
      color: 'rgba(4, 205, 24, .75)'
    - from: 25
      to: 40
      color: 'rgba(239, 93, 13, .75)'
  borders: true
  colorPlate: ''
  colorNumbers: '#ccc'
  colorTitle: '#f5f5f5'
  animatedValue: true
  valueDec: 0
type: 'custom:canvas-gauge-card'
1 Like

@xbmcnut - how do you actually use this? Do you need to install the custom card through HACS? Can you just use the manual card after that?

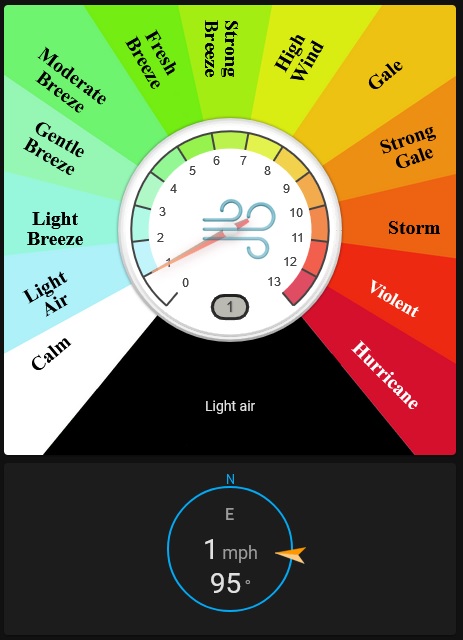
Yep, install “Canvas Gauge Card” through HACS and then activate right in the integration page to get it into LL. Then add a manual card, paste the code and adjust the entity (and height/width). Changed mine now with a black border and a ‘units’ reading at the bottom. Use in conjunction with the ‘slate’ theme.

EDIT: Changed the code so that the value display shows two numbers with one decimal point.

  valueDec: 1
  valueInt: 2

entity: sensor.humidity_xiaomi_outside
font_size: 1em
gauge:
  animatedValue: true
  borders: true
  colorBorderOuter: '#333'
  colorBorderOuterEnd: '#111'
  colorBorderMiddle: '#222'
  colorBorderMiddleEnd: '#111'
  colorBorderInner: '#111'
  colorBorderInnerEnd: '#333'
  colorNumbers: '#ccc'
  colorPlate: ''
  colorTitle: '#f5f5f5'
  colorUnits: '#f5f5f5'
  height: 240
  highlights:
    - color: 'rgba(74, 123, 180, .75)'
      from: 0
      to: 40
    - color: 'rgba(4, 205, 24, .75)'
      from: 40
      to: 70
    - color: 'rgba(239, 93, 13, .75)'
      from: 70
      to: 100
  majorTicks:
    - '0'
    - '10'
    - '20'
    - '30'
    - '40'
    - '50'
    - '60'
    - '70'
    - '80'
    - '90'
    - '100'
  maxValue: 100
  minValue: 0
  minorTicks: 2
  startAngle: 45
  strokeTicks: true
  ticksAngle: 270
  title: Outside Humidity
  units: (%)
  type: radial-gauge
  valueBox: true
  valueDec: 1
  valueInt: 2
  width: 230
type: 'custom:canvas-gauge-card'

Full guide here https://canvas-gauges.com/documentation/user-guide/

3 Likes

Great, thanks.

1 Like

Hi
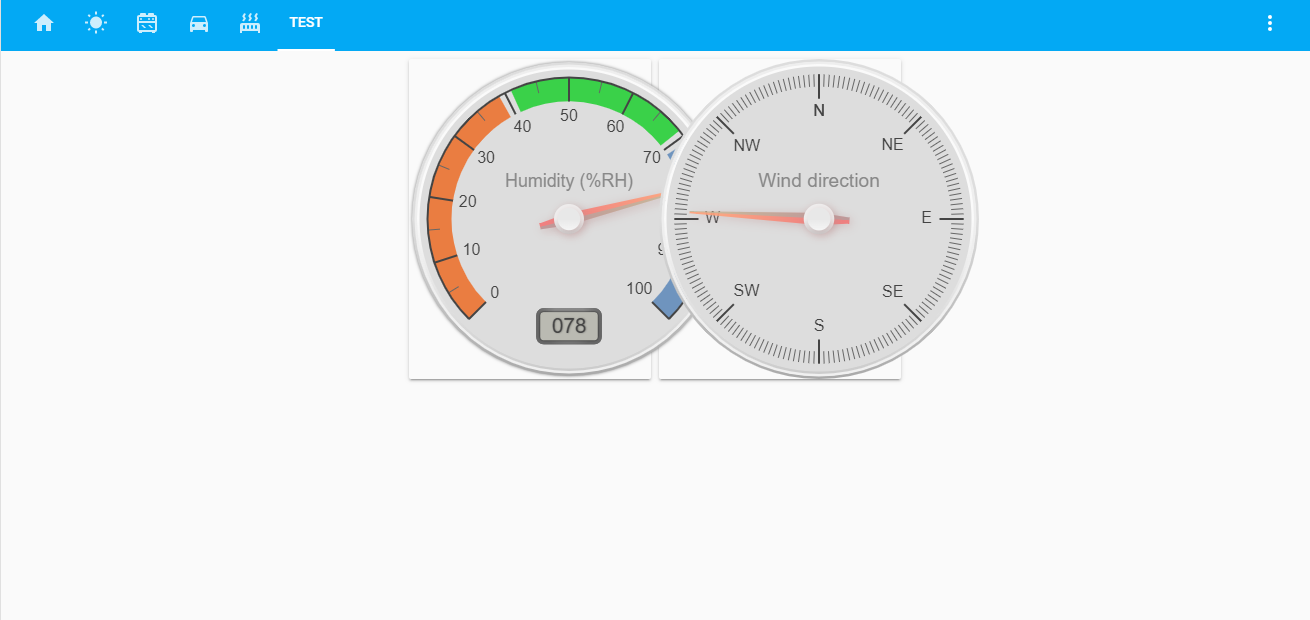
I was able to display my gauge with below code.
To have a background card color, I used Mod-Card also (info got from another post) (otherwise I have my gauge on a full transparent Card which is not what I wanted)

I have an issue with a black horizontal line visible below my gauge (whatever if I use ot not the Mod-Card). Here is below pointed with my yellow arrow.
Any idea from where it comes ? How could I remove it ?
Thanks

image

type: 'custom:mod-card'
style: |
  ha-card {
    background-color: var(--secondary-background-color);
    padding: 8px 0px 8px 0px;
  }
card:
  type: 'custom:canvas-gauge-card'
  entity: sensor.netatmo_maison_interne_co2
  shadow_height: 12%
  font_size: 1em
  gauge:
    type: radial-gauge
    units: CO2
    width: 200
    height: 200
    borderShadowWidth: 0
    borderOuterWidth: 0
    borderMiddleWidth: 0
    borderInnerWidth: 0
    minValue: 0
    maxValue: 5000
    startAngle: 40
    ticksAngle: 280
    valueBox: false
    majorTicks:
      - '0'
      - '500'
      - '1000'
      - '1500'
      - '2000'
      - '2500'
      - '3000'
      - '3500'
      - '4000'
      - '4500'
      - '5000'
    minorTicks: 2
    strokeTicks: true
    highlights:
      - from: 0
        to: 1000
        color: green
      - from: 1001
        to: 2500
        color: orange
      - from: 2501
        to: 5000
        color: red
    colorPlate: white
    borders: false

Mine ends up with a white background (not using mod-card). I actually want a transparent background on the card lol.

Add style section, probably disregard all other than style / background-color.

    style:
      top: 50%
      left: 50%
      width: null
      heigth: null
      box-shadow: none
      background-color: transparent
      transform: scale(1,1) translate(-50%,-50%)

For other examples:
https://github.com/GlennGoddard/CanvasGaugeBackgrounds

Really love this card because of it’s simplicity.

Thank you Tomas!

Thank you for the feedback and showing how it’s used!. Appreciate it!

1 Like

I need to organize mine a little better; I like your nice clean layout.
In case you want to spice up your canvas gauges just a bit:


The unlabeled one is heat stress.

Hi, how did you allign the cauges in a horziotal stack?
My alignments are going wrong

I think the sizes of your gages are probably too big.
Try the transform function that is a few post up from here.
Post your yaml also, just in case there is something in there.