 I don’t know enough about web browsers to say. If I did I’d fork it and fixit.
1 Like
I just manage to get it back in Firefox 110

Not sure exactly what step did it, so if someone wanna give it a try this is my little findings:
- First of all, i use a fork by " greendog99 (Mike Fischer) · GitHub "
- before editing any file, do a full history-clear ( browsing, download, cache )
- if nothing change, then check whether you have only 1 place for the “js-file” , somehow in FF debugger, i had an “additional” outside /hacs-files , and that was /local/com… ( Thou that was not what the “Resources in Lovelace” said ), there i only had /hacsfiles/…
- in that file i edited 2nd row, as it appeared that in my case, it only said “WEATHER-CHART” so i change to WEATHER-CHART-CARD

Id added and modded to my satisfaction 

1 Like
looks way better 
would you mind, sharing the yaml?
1 Like
well i actually combined it with a part of weather-chart-card, but i guess you could use another, then you just have to figure out how/where to hide the elements yo dont want … it’s not an optimal “solution”, it’s more like a dirty Trick N Cheat
EDIT: i changed the span:start and the offset: as well
type: custom:apexcharts-card
graph_span: 5d
span:
  start: day
  offset: +1d
header:
  show: false
  show_states: false
all_series_config:
  stroke_width: 3
  group_by:
    func: last
    duration: 1d
now:
  show: true
apex_config:
  plotOptions:
    bar:
      columnWidth: 30%
  legend:
    show: true
  xaxis:
    labels:
      format: ddd
    tooltip:
      enabled: false
  tooltip:
    x:
      format: ddd dd. MMM.
yaxis:
  - id: temp
    min: auto
    max: auto
    decimals: 0
series:
  - entity: weather.forecast_home
    name: min.
    yaxis_id: temp
    unit: °C
    type: line
    color: green
    data_generator: |
      return entity.attributes.forecast.map((entry) =>
      {
        var date = new Date(entry.datetime);

        return [date, entry.templow];
      });
    show:
      datalabels: false
  - entity: weather.forecast_home
    name: max.
    yaxis_id: temp
    unit: °C
    type: line
    color: '#FFBF00'
    data_generator: |
      return entity.attributes.forecast.map((entry) =>
      {
        var date = new Date(entry.datetime);

        return [date, entry.temperature];
      });
    show:
      datalabels: false
  - entity: weather.forecast_home
    name: Precip
    yaxis_id: mm
    unit: mm
    type: column
    color: '#6495ED'
    data_generator: |
      return entity.attributes.forecast.map((entry) =>
      {
        var date = new Date(entry.datetime);

        return [date, entry.precipitation];
      });
    show:
      datalabels: true
Here are Hourly, for current day( or it’s a actually 24hours-view “-1h” ), with wind-speed instead of temp-low

1 Like
Dude, make a github repo for this, I love it!
Well the Credit should go to @PulsarFX above, as i first installed apex-charts after seeing his example above, so my “contribution” comes down to just a little fiddling around, in settings. but it also have to be adapted to the other cards in ones view ( as it is now, with the weather-chart-card, in bottom )
The Hourly part is “stand alone apex-chart” … also based upon PulsarFX work
type: custom:apexcharts-card
graph_span: 24h
span:
  start: hour
  offset: '-1h'
hours_12: false
header:
  show: false
  show_states: false
all_series_config:
  stroke_width: 3
  group_by:
    func: raw
    duration: 30m
now:
  show: true
apex_config:
  plotOptions:
    bar:
      columnWidth: 30%
  legend:
    show: true
  xaxis:
    labels:
      format: hhh
    tooltip:
      enabled: false
  tooltip:
    x:
      format: ddd dd. hhh. mmm.
yaxis:
  - id: temp
    min: auto
    max: auto
    decimals: 0
series:
  - entity: weather.forecast_home_hourly
    name: Wind m/s
    yaxis_id: wind_speed
    unit: m/s
    type: line
    color: green
    data_generator: |
      return entity.attributes.forecast.map((entry) =>
      {
        var date = new Date(entry.datetime);

        return [date, entry.wind_speed];
      });
    show:
      legend_value: false
      datalabels: false
  - entity: weather.forecast_home_hourly
    name: Temp °C
    yaxis_id: temp
    unit: °C
    type: line
    color: '#FFBF00'
    data_generator: |
      return entity.attributes.forecast.map((entry) =>
      {
        var date = new Date(entry.datetime);

        return [date, entry.temperature];
      });
    show:
      legend_value: false
      datalabels: false
  - entity: weather.forecast_home_hourly
    name: Precip mm
    yaxis_id: mm
    unit: mm
    type: column
    color: '#6495ED'
    data_generator: |
      return entity.attributes.forecast.map((entry) =>
      {
        var date = new Date(entry.datetime);

        return [date, entry.precipitation];
      });
    show:
      legend_value: false
      datalabels: false
… and i really don’t know how to make a “repo”, i did “fork” some i was interested in/using ( also went through your weather-chart-fork ) 
Ah didn’t notice that this was apex-charts based. Thought it was still somehow based on the original card. Nice that we have some options as the original card is getting hard to maintain.
1 Like
We have the Share your projects! Category for this. Don’t let it get buried in this abandoned topic please.
Do you also show the days in vertical columns like the former card did? Personally I always try to take out those horizontal grid lines but it’s hard using apex in a clean way for me.
Maybe you can…
I just started with this apex-chart, thou i will look into it, im sure it should be easy to remove the horizontals line… im about to combine both, in a vertical-stack, and use ha-native met.no_ weather-home ( instead of weather-chart-card ) for the “conditions” … i could post it in “Share your Project” now that you mention it … currently still struggling with “url” to external icons for the native " Met.no weather-home"
apex_config:
  grid:
    borderColor: none

remove lines ...

    apex_config:
      grid:
        xaxis:
          lines:
            show: Boolean
        yaxis:
          lines:
            show: false
vertical lines

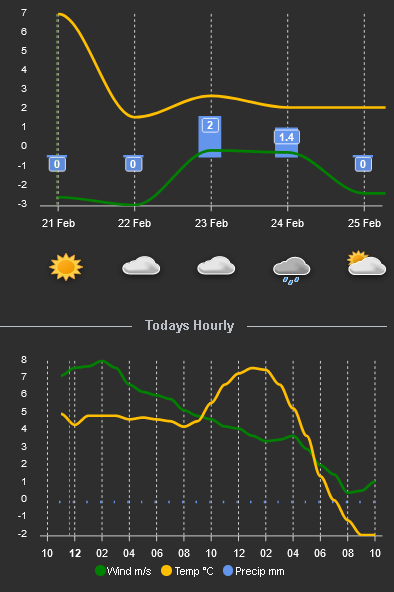
PS: it’s not “todays hourly” anymore , i changed it to 24hours ahead -1h
apex_config:
   grid:
     strokeDashArray: 0
Full-lines instead of dots !

wonderful!
now add column titles (days/dates) and its’ perfect
thank you!!
Where ? , on the days overview you got dates, you want days/dates in every hourly column ?.. if you move your mouse over the “grid(s)” you´ll see the day/dates
yeah, I am sorry, I think I didnt check correctly.
Guess I am still used to seeing the days/dates at the top of the graph instead of below the graph. I do think it would give it the graph that bit more ‘structure’. Currently, the middle section

is a bit large. moving the days to the top would bring more balance imho.
could you solve this offset issue? It happens during the day, when its like 12 o clock.

Hi, i’ve noticed this as well, most annoying for the “day-view”, and i think the “answer” is somewhere in the “weather” integration ( the way/time it changes ), i’ve tried several “options” in apexchart
I get back to you if i figure it out … thou im afraid it somehow will get uggly, as the graph doesn’t seems to “update/rotate” chart/day at midnight
xaxis:
    position: 'top'
Regarding the “middel-section” , it is a (hack) nothing i would share in a “Project Solution” ( it is weather-chart-card, and easy to reduce size ) … i could use native “type: weather” as i’ve “modded” this as well to only show " conditions" for days
When i find a way to use native “type: weather” , with external url to optional icons, i let you know
I use weather-chart-card as i can refer to icons in /local … don’t know how to do this in native-card … i bet you do ![]()
PS: i don’t like the date at top, as it looks now, but maybe i should move the “Conditions” (middel-section) to the top as-well
EDIT: new pic

uhm, well, all weather cards I use/have hacked use local icons.
more over, I have adapted all my cards to change to from very complex weather icon templates, to simply use a night/day boolean, and append some icons relevant to night.
other than that, I don’t really know what you want to do with the icons?
I’ve monitored below setting, seems like it’s “steady”
  - type: custom:apexcharts-card
    graph_span: 5d
    span:
      start: day
      offset: +1d
    header:
      show: false
      show_states: false
    all_series_config:
      stroke_width: 2
      group_by:
        func: last
        duration: 1d
        start_with_last: true
- I’ve tried with 6 days, thou then the last day is without “condition” (icon) , caused by the “weather.forecast_home” “met.no” only shows 5 days
- offset: +1d, seems to work better, again do to “weather.forecast_home/met.no”, as it’s for the next day, Then “offset” will be to the most left( as you see the red-dotted “now” line)
- the 3 sets in “group_by”, seems to work best in this scenario, i added “start_with_last: true” ( in hourly graph also )

I’ve played around with “condition” for the hourly graph ( in between 24-hours-header-line and graph ) but i’t only possible to get a view of 7-8 hours ahead, WITH smaller condition-icons above hour-graph … unless you have your weather-graphs in a full-panel view

Compared-timeshift-now
