I have a binary sensor that gives me an on/off state of a device. I do get 0/1 values from a helper.
The device has a warm-up and cool-down phase that perfectly matches a typical exponential low-pass filter. I want to get a value of the current warm-up state.
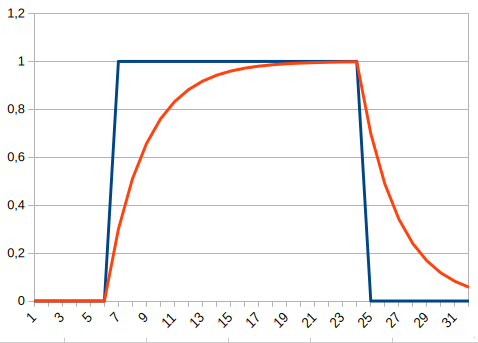
The on-cycle may be shorter or longer than shown here, so it may not reach 0.8 before cooling off again. Or it may be switched off after a long run and quickly on again, keeping the warm-up-value high. So the warm-up does not necessarily start at zero but at the value to what the “off” state cooled down the curve before.
That looks like two problems to me:
- the sensor value is not time dependent and changes only when a change occurs. It is “still on” but I cannot integrate on the value. After switching “on”, the low-pass filtered sensor switches to 0.05 and sits there until the device goes off again. I would have to link this to the “time sitting in this state”.
- the “window size” and “time constant” parameters are quite vague. They might get any arbitrary value and I still cannot guess how this will affect the output.
The idea is to get the curve from zero to >0,99 after 20 minutes (or seconds).
If I can solve problem 1, would I have to set Window-Size=1, time-constant = 20 to get a “20 time-element” wide warm-up curve?
Could I use a different approach to calculate the red curve from the blue one, or at least one that is similar enough?
I could calculate this with an electronic RC circuit, but this one confuses me. And other than in a spreadsheet I cannot just try out some values and watch the result. I always have to measure and wait through a real cycle to collect real values.
Any ideas?